By Castleport Test Prep Editorial Team Last verified: August 6, 2026 · Dataset version: 1.0
Castleport Research is an independent research and reference section published by Castleport Test Prep. Castleport Test Prep is not affiliated with ASHA, CAA, ETS, or any school named here.
The finding
ASHA’s two official 2024–25 SLP Praxis reports both list 8,639 passes. Count all 10,410 score records and the pass rate is 83.0%. Keep only each person’s highest score and it is 94.1% across 9,177 people.
This SLP Praxis pass rates by program dataset adds a separate 56-record check of what schools publish. The recalculated three-period rates run from 74.8% to 100%. Four of 41 school-posted three-period figures differ by at least half a point from the counts printed on the same page.
Same passes. Two national denominators. An 11.1-point gap.
Both national reports cover people who named ASHA as a score recipient. The 83.0% figure is not a first-attempt rate. It counts every score in ASHA’s all-score report, including repeat scores. The 94.1% figure keeps one highest score per person.
The numbers, in one place
| What we measured | Verified figure |
|---|---|
| National rate counting all score records, 2024–25 | 83.0% — 8,639 passes out of 10,410 scores |
| National rate keeping one highest score per person, 2024–25 | 94.1% — 8,639 passes among 9,177 people |
| Gap between the two official rates | 11.1 points |
| Gap in 2014–15 | 6.0 points |
| Program or delivery-mode records audited | 56 |
| Institutions represented | 47 across 26 states and Washington, D.C. |
| Program test-taker records across all periods | 5,451 — not 5,451 different people |
| Recalculated three-period range | 74.8% to 100% |
| Group sizes behind those rates | 15 to 501 test-taker records |
| Records plainly labeled first-attempt | 1 of 56 |
| School-posted three-period figures checked | 41 |
| Posted figures off by 0.5 point or more | 4 |
Source: ASHA’s all-score national report, ASHA’s highest-score-only national report, and 47 official school outcome pages. Compiled and recalculated by Castleport Test Prep; verified August 6, 2026.
Scope: This is a verified audit of public pages. It is not a full count of every SLP program, a random sample, or a best-program list. The 5,451 program test-taker records are counts across reporting periods, not 5,451 unique people.
Data files: Program CSV · Program JSON · National series CSV · Source manifest
Why are there two national SLP Praxis pass rates?
ASHA publishes two reports on the same exam, and they count different things. One counts every score record. The other keeps only each person’s highest score. For 2024–25, those rules give 83.0% and 94.1%.
Here is how that can happen. Say ten people take the test. Nine pass the first time. One fails, studies, and passes on the second try.
- Counting every score: 11 scores were earned. Ten passed. That is 90.9%.
- Keeping one highest score per person: Ten people took it. All ten have a passing highest score. That is 100%.
Nobody lied. The two numbers answer different questions. The first asks, “How did all reported scores turn out?” The second asks, “How many people had a passing highest score?”
Now scale that up. In 2024–25, ASHA’s all-score report contains 1,233 more records than its highest-score-only report contains people. The all-score report lists 1,771 failing records. The highest-score-only report lists 538 people whose highest score was failing. That is also a difference of 1,233.
The reports do not show each person’s test history, so they cannot tell us how many people failed once, failed more than once, or later passed. They do show exactly why a counting rule can move the headline rate by eleven points.
The two national rates, 2014–15 through 2024–25
| Test year | All score records | All-score passes | All-score rate | People, highest score only | Highest-score passes | Highest-score rate | Gap |
|---|---|---|---|---|---|---|---|
| 2024–2025 | 10,410 | 8,639 | 83% | 9,177 | 8,639 | 94.1% | 11.1 pts |
| 2023–2024 | 9,776 | 7,929 | 81.1% | 8,604 | 7,926 | 92.1% | 11.0 pts |
| 2022–2023 | 9,828 | 8,073 | 82.2% | 8,582 | 8,072 | 94.1% | 11.9 pts |
| 2021–2022 | 9,274 | 7,704 | 83.1% | 8,226 | 7,704 | 93.7% | 10.6 pts |
| 2020–2021 | 8,394 | 7,320 | 87.2% | 7,718 | 7,317 | 94.8% | 7.6 pts |
| 2019–2020 | 9,398 | 8,477 | 90.2% | 8,787 | 8,479 | 96.5% | 6.3 pts |
| 2018–2019 | 9,178 | 8,214 | 89.5% | 8,494 | 8,214 | 96.7% | 7.2 pts |
| 2017–2018 | 8,833 | 8,082 | 91.5% | 8,376 | 8,125 | 97% | 5.5 pts |
| 2016–2017 | 9,682 | 8,791 | 90.8% | 9,042 | 8,789 | 97.2% | 6.4 pts |
| 2015–2016 | 9,132 | 8,264 | 90.5% | 8,520 | 8,264 | 97% | 6.5 pts |
| 2014–2015 | 8,454 | 7,634 | 90.3% | 7,928 | 7,635 | 96.3% | 6.0 pts |
Source: ASHA all-score report and ASHA highest-score-only report. Castleport placed the two official series side by side, recalculated every rate from the published counts, and computed each gap. Verified August 6, 2026.
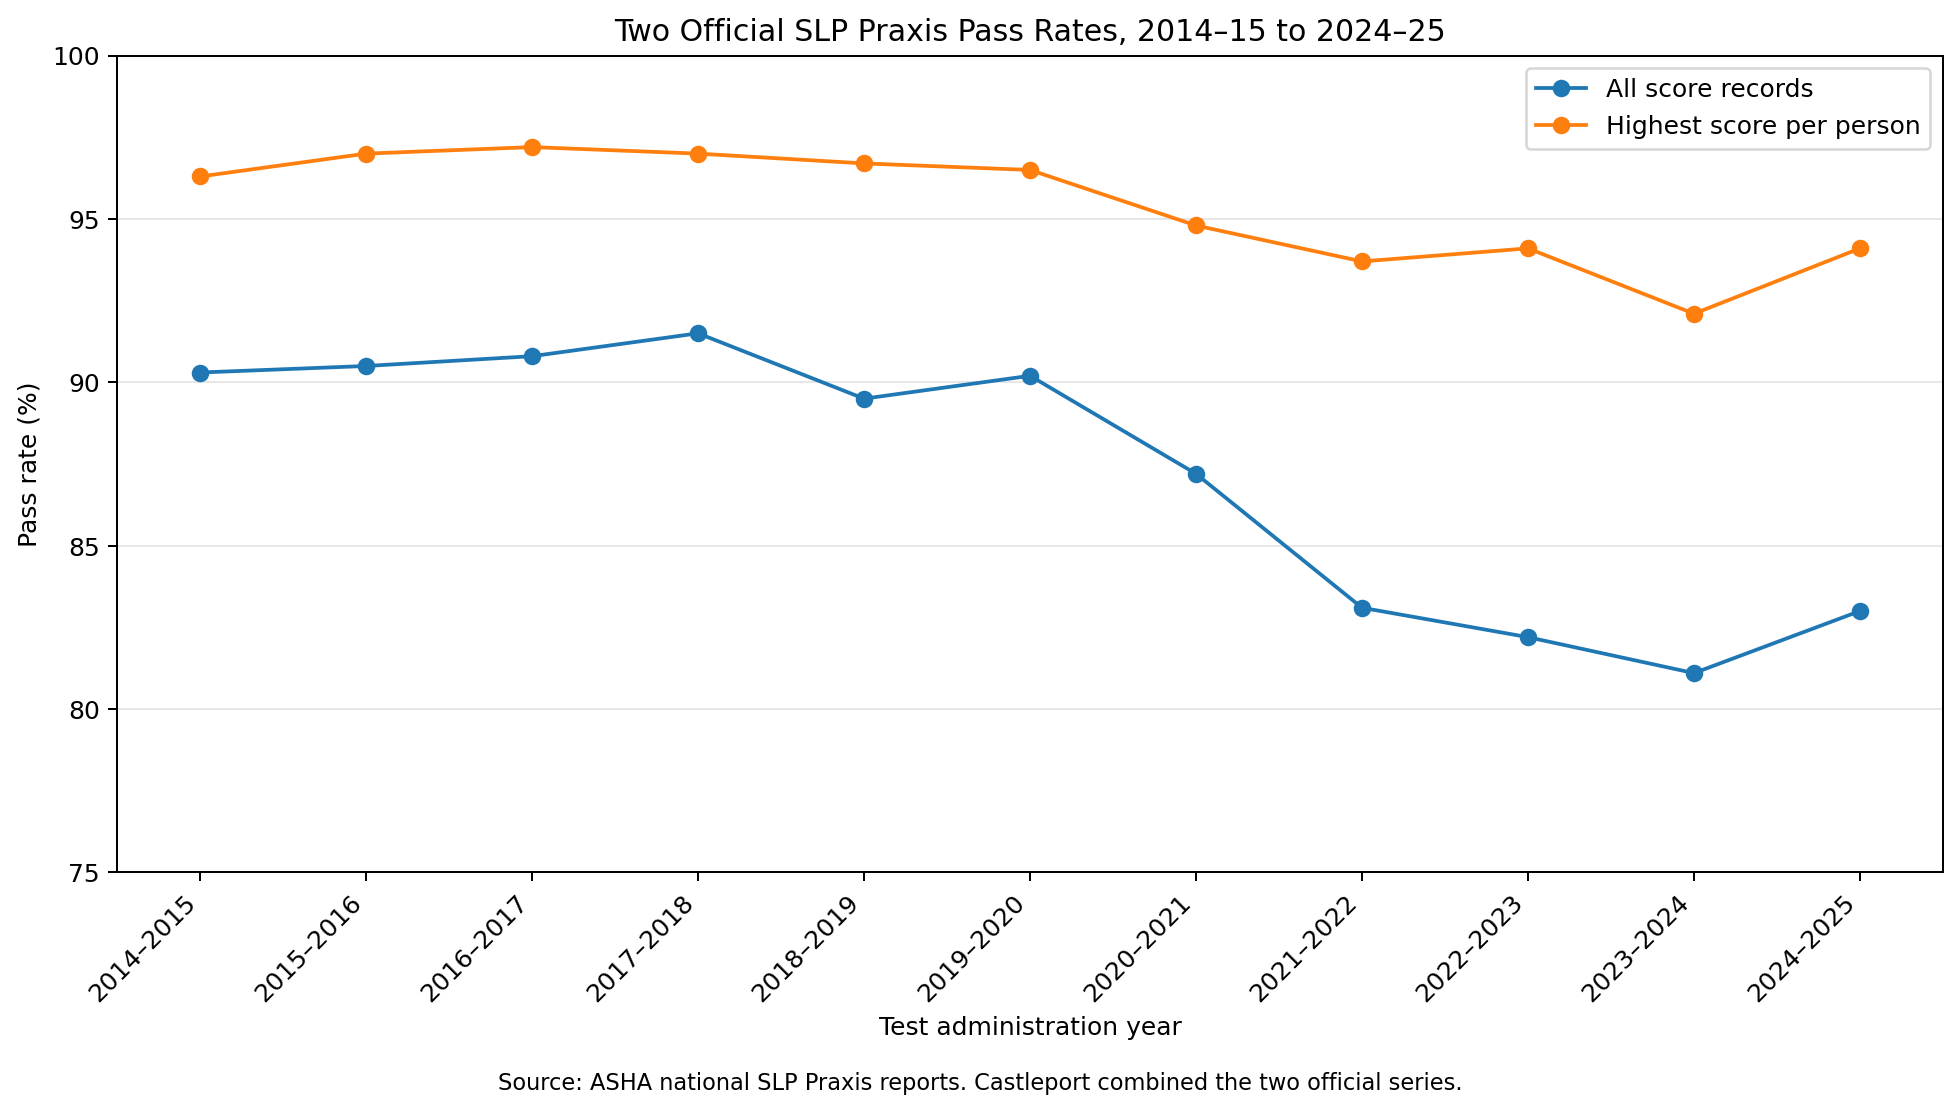
Chart source: the two ASHA national reports above. Graphic and gap calculations by Castleport Test Prep.
What changed over ten years
Both rates fell. But they did not fall the same way.
- The all-score rate dropped 7.3 points: 90.3% to 83.0%.
- The highest-score-only rate dropped 2.2 points: 96.3% to 94.1%.
- The gap grew from 6.0 points to 11.1 points.
- The number of all-score records per highest-score person rose from about 1.07 to 1.13.
That last figure is consistent with more duplicate score records per person. It does not tell us why the pattern changed.
One thing the two reports do not reconcile
We recomputed all 22 rates in the table above. Every published percentage matches its own count after rounding.
But three years look odd when the two reports are put side by side. In 2014–15, 2017–18, and 2019–20, the highest-score-only report lists more passing people than the all-score report lists passing score records.
| Test year | Passing score records | People with a passing highest score | Difference |
|---|---|---|---|
| 2014–15 | 7,634 | 7,635 | 1 |
| 2017–18 | 8,082 | 8,125 | 43 |
| 2019–20 | 8,477 | 8,479 | 2 |
Source: Castleport Research audit, verified August 6, 2026.
That cannot come from one perfectly matched set in which every person-level pass also appears as a passing score record. ASHA’s reports do not explain the difference. It does not affect 2024–25, when both reports list exactly 8,639 passes.
Which national rate should you use?
Name the rule when you use the number. Say “83.0% of all score records passed” or “94.1% of people had a passing highest score.” Neither number should stand alone as “the national pass rate.”
How does a program’s Praxis pass rate actually get built?
Six published rules shape the number before it reaches a school’s website. The ETS roster is only one input. CAA also tells programs to compare ETS data with their own records and report all test takers who belong in the period.
| Step | The published rule | What it means |
|---|---|---|
| 1 | A test taker must identify the school to ETS, using the school’s attending-institution code, for that person to appear in the school’s ETS report. | A missing or wrong school code can leave a person out of the ETS institutional data. |
| 2 | ETS sends the school an Annual Institution Delete Roster. The school may delete names it believes do not belong. It may not add names to that ETS roster. | The preliminary ETS roster has a one-way edit. |
| 3 | The annual ETS Institutional Summary Report contains each candidate’s highest score for that reporting period. | A fail followed by a pass in the same period appears through the highest score, not as a first-attempt result. |
| 4 | ETS generates the annual institutional summary only when at least five candidates identified the institution. | A small program may need its own records because ETS may not send the summary. |
| 5 | CAA uses a testing year or examination cycle, not a graduating class. A reporting period may include people who graduated within the prior three years. | One annual row can mix people from more than one graduating class. |
| 6 | CAA says a repeat test taker counts once within one reporting period, but should appear in both years if the person tests in two different reporting periods. Programs should compare ETS data with their own records and report all test takers who belong. | The same person can appear in two annual rows if the retest crosses reporting years. |
Sources: ASHA, Praxis Scores and Score Reports; CAA, Presenting Student Achievement Data; CAA, Documenting Compliance. Verified August 6, 2026.
The roster step, in plain terms
Each August, ETS sends an SLP program a preliminary roster of people who named that school. ASHA tells the program to strike names it believes should not be represented. The program cannot add names to that ETS roster.
There are good reasons a name may not belong: the person transferred, never enrolled, or chose the wrong code. We found no evidence of misuse. But the edit step is real, and none of the 47 program pages in this audit explains it.
The roster is not the whole public-table rule. CAA tells programs to compare the ETS report with their own data and report all test takers who belong in the cycle. So it would be wrong to say that a school can only shrink its final public denominator.
The exam is not meant to clear someone for graduation
ASHA says ETS recommends that programs not use the Praxis as a final exam for graduation clearance. CAA says the exam is designed for people who have completed the academic and clinical work and may already be in a longer clinical placement or fellowship.
That matters when you read a school’s table. The reporting period is not the graduating class, and the people may test on different schedules.
SLP Praxis pass rates by program: 56 verified records
These rows show what 47 schools published for three visible reporting periods. They do not all use the same dates, delivery modes, or attempt labels.
The table stays alphabetical on purpose. A 15-record result and a 501-record result should not look like equal evidence just because the percentages can be sorted.
| Program / mode | State | Three visible periods, passed/took | Three-period total | Recalculated rate | School-posted rate | Attempt label on page | Source |
|---|---|---|---|---|---|---|---|
| Adelphi University — MS Speech-Language Pathology — residential component | NY | 2025–2026 19/23; 2024–2025 55/64; 2023–2024 30/52 | 104/139 | 74.82% | — | Not clearly stated | Official page, checked Aug. 6, 2026 |
| Adelphi University — MS Speech-Language Pathology — satellite component | NY | 2025–2026 3/3; 2024–2025 7/8; 2023–2024 13/19 | 23/30 | 76.67% | — | Not clearly stated | Official page, checked Aug. 6, 2026 |
| Appalachian State University — MS Speech-Language Pathology | NC | 2025–2026 34/34; 2024–2025 31/31; 2023–2024 33/33 | 98/98 | 100% | — | Not clearly stated | Official page, checked Aug. 6, 2026 |
| Arkansas State University — Master of Communication Disorders / SLP | AR | 2025–2026 19/21; 2024–2025 26/28; 2023–2024 29/30 | 74/79 | 93.67%† | 90%† | Not clearly stated | Official page, checked Aug. 6, 2026 |
| Auburn University — MS Speech-Language Pathology | AL | 2024–2025 22/23; 2023–2024 21/21; 2022–2023 24/24 | 67/68 | 98.53% | 98.5% | Not clearly stated | Official page, checked Aug. 6, 2026 |
| Baylor University — MS Communication Sciences and Disorders — on-campus | TX | 2023–2024 74/76; 2022–2023 65/68; 2021–2022 50/54 | 189/198 | 95.45% | 95% | Not clearly stated | Official page, checked Aug. 6, 2026 |
| Baylor University — MS Communication Sciences and Disorders — online | TX | 2023–2024 145/157; 2022–2023 125/136; 2021–2022 182/208 | 452/501 | 90.22% | 90% | Not clearly stated | Official page, checked Aug. 6, 2026 |
| Bowling Green State University — MS Speech-Language Pathology | OH | 2025–2026 15/15; 2024–2025 31/31; 2023–2024 27/28 | 73/74 | 98.65% | — | Not clearly stated | Official page, checked Aug. 6, 2026 |
| California Baptist University — MS Speech-Language Pathology | CA | 2025–2026 24/26; 2024–2025 25/26; 2023–2024 16/19 | 65/71 | 91.55% | 91.5% | Not clearly stated | Official page, checked Aug. 6, 2026 |
| California State University, Fresno — MA Speech-Language Pathology | CA | 2025 23/23; 2024 23/23; 2023 24/28 | 70/74 | 94.59% | 95% | Not clearly stated | Official page, checked Aug. 6, 2026 |
| Calvin University — MA Speech-Language Pathology — distance component | MI | 2024–2025 35/36; 2023–2024 12/13; 2022–2023 9/9 | 56/58 | 96.55% | — | Not clearly stated | Official page, checked Aug. 6, 2026 |
| Calvin University — MA Speech-Language Pathology — residential component | MI | 2024–2025 26/26; 2023–2024 25/25; 2022–2023 27/27 | 78/78 | 100% | — | Not clearly stated | Official page, checked Aug. 6, 2026 |
| Cleveland State University — MA Speech-Language Pathology | OH | 2025–2026 29/30; 2024–2025 30/32; 2023–2024 27/33 | 86/95 | 90.53%† | 93%† | First attempt | Official page, checked Aug. 6, 2026 |
| Gallaudet University — MS Speech-Language Pathology | DC | 2024–2025 20/21; 2023–2024 13/15; 2022–2023 16/16 | 49/52 | 94.23% | 94% | Not clearly stated | Official page, checked Aug. 6, 2026 |
| George Washington University — MA Speech-Language Pathology | DC | 2024 44/46; 2025 42/43; 2026 36/38 | 122/127 | 96.06% | 96% | Not clearly stated | Official page, checked Aug. 6, 2026 |
| Howard University — MS Speech-Language Pathology | DC | 2024–2025 4/6; 2023–2024 2/2; 2022–2023 7/8 | 13/16 | 81.25%† | 85%† | Not clearly stated | Official page, checked Aug. 6, 2026 |
| Idaho State University — MS Speech-Language Pathology — Meridian | ID | 2024–2025 15/15; 2023–2024 17/17; 2022–2023 16/16 | 48/48 | 100% | 100% | Not clearly stated | Official page, checked Aug. 6, 2026 |
| Idaho State University — MS Speech-Language Pathology — Pocatello | ID | 2024–2025 9/9; 2023–2024 8/8; 2022–2023 14/14 | 31/31 | 100% | 100% | Not clearly stated | Official page, checked Aug. 6, 2026 |
| Idaho State University — MS Speech-Language Pathology — online | ID | 2024–2025 15/15; 2023–2024 13/13; 2022–2023 11/11 | 39/39 | 100% | 100% | Not clearly stated | Official page, checked Aug. 6, 2026 |
| Illinois State University — MS Speech-Language Pathology | IL | 2025–2026 31/32; 2024–2025 38/38; 2023–2024 34/34 | 103/104 | 99.04% | — | Not clearly stated | Official page, checked Aug. 6, 2026 |
| Maryville University — MS Speech-Language Pathology — residential component | MO | 2024–2025 27/28; 2023–2024 15/16; 2022–2023 19/19 | 61/63 | 96.83% | — | Not clearly stated | Official page, checked Aug. 6, 2026 |
| Minnesota State University Moorhead — MS Speech-Language Pathology | MN | 2024–2025 25/27; 2023–2024 23/24; 2022–2023 22/22 | 70/73 | 95.89% | 96% | Not clearly stated | Official page, checked Aug. 6, 2026 |
| Moravian University — MS Speech-Language Pathology | PA | 2025–2026 23/26; 2024–2025 19/20; 2023–2024 23/23 | 65/69 | 94.2% | — | Not clearly stated | Official page, checked Aug. 6, 2026 |
| Murray State University — MS Speech-Language Pathology | KY | 2025–2026 23/28; 2024–2025 18/19; 2023–2024 30/30 | 71/77 | 92.21% | 92% | Not clearly stated | Official page, checked Aug. 6, 2026 |
| Nazareth University — MS Speech-Language Pathology | NY | 2025–2026 24/25; 2024–2025 38/38; 2023–2024 28/28 | 90/91 | 98.9% | — | Not clearly stated | Official page, checked Aug. 6, 2026 |
| Nevada State University — MS Speech-Language Pathology | NV | 2025–2026 36/42; 2024–2025 24/26; 2023–2024 14/16 | 74/84 | 88.1% | 88% | Not clearly stated | Official page, checked Aug. 6, 2026 |
| New York Medical College — MS Speech-Language Pathology | NY | 2024–2025 29/31; 2023–2024 21/23; 2022–2023 35/35 | 85/89 | 95.51%† | 94.9%† | Not clearly stated | Official page, checked Aug. 6, 2026 |
| New York University — MS Communicative Sciences and Disorders — on-campus | NY | 2025–2026 27/29; 2024–2025 32/33; 2023–2024 22/24 | 81/86 | 94.19% | 94.19% | Not clearly stated | Official page, checked Aug. 6, 2026 |
| Northeastern State University — MS Speech-Language Pathology | OK | 2024–2025 27/28; 2023–2024 22/22; 2022–2023 30/30 | 79/80 | 98.75% | 98.8% | Not clearly stated | Official page, checked Aug. 6, 2026 |
| Northeastern University — MS Speech-Language Pathology — Boston | MA | 2025–2026 47/53; 2024–2025 58/61; 2023–2024 27/29 | 132/143 | 92.31% | — | Not clearly stated | Official page, checked Aug. 6, 2026 |
| Ohio University — MA Speech-Language Pathology | OH | 2025–2026 37/39; 2024–2025 32/33; 2023–2024 34/37 | 103/109 | 94.5% | — | Not clearly stated | Official page, checked Aug. 6, 2026 |
| Pacific University — MS Speech-Language Pathology | OR | 2025–2026 13/17; 2024–2025 18/21; 2023–2024 23/25 | 54/63 | 85.71% | — | Not clearly stated | Official page, checked Aug. 6, 2026 |
| Texas State University — MS Communication Disorders / SLP | TX | 2025–2026 31/35; 2024–2025 32/34; 2023–2024 32/33 | 95/102 | 93.14% | 93% | Not clearly stated | Official page, checked Aug. 6, 2026 |
| Touro University — MS Speech-Language Pathology | NY | 2025–2026 38/42; 2024–2025 42/42; 2023–2024 45/49 | 125/133 | 93.98% | 94% | Not clearly stated | Official page, checked Aug. 6, 2026 |
| University of Arizona — MS Speech-Language Pathology | AZ | 2025–2026 26/26; 2024–2025 24/24; 2023–2024 29/29 | 79/79 | 100% | 100% | Not clearly stated | Official page, checked Aug. 6, 2026 |
| University of Arkansas for Medical Sciences — MS Communication Sciences and Disorders / SLP | AR | 2024–2025 22/23; 2023–2024 22/22; 2022–2023 23/23 | 67/68 | 98.53% | 98.5% | Not clearly stated | Official page, checked Aug. 6, 2026 |
| University of Illinois Urbana-Champaign — MA Speech-Language Pathology | IL | 2024–2025 25/25; 2023–2024 22/22; 2022–2023 26/26 | 73/73 | 100% | 100% | Not clearly stated | Official page, checked Aug. 6, 2026 |
| University of Kentucky — MS Communication Sciences and Disorders / SLP | KY | 2025–2026 24/25; 2024–2025 35/36; 2023–2024 29/30 | 88/91 | 96.7% | 97% | Not clearly stated | Official page, checked Aug. 6, 2026 |
| University of Louisiana at Lafayette — MS Speech-Language Pathology | LA | 2024–2025 17/19; 2023–2024 17/20; 2022–2023 17/17 | 51/56 | 91.07% | 91.47% | Not clearly stated | Official page, checked Aug. 6, 2026 |
| University of Massachusetts Amherst — MA Speech-Language Pathology | MA | 2024–2025 25/25; 2023–2024 22/22; 2022–2023 19/19 | 66/66 | 100% | 100% | Not clearly stated | Official page, checked Aug. 6, 2026 |
| University of South Carolina — MS Speech-Language Pathology — distance component | SC | 2024–2025 24/25; 2023–2024 33/34; 2022–2023 31/31 | 88/90 | 97.78% | 97.6% | Not clearly stated | Official page, checked Aug. 6, 2026 |
| University of South Carolina — MS Speech-Language Pathology — residential component | SC | 2024–2025 33/33; 2023–2024 38/38; 2022–2023 34/34 | 105/105 | 100% | 100% | Not clearly stated | Official page, checked Aug. 6, 2026 |
| University of St. Augustine for Health Sciences — MS Speech-Language Pathology — Austin cohort | TX | 2024–2025 109/117; 2023–2024 59/71; 2022–2023 52/61 | 220/249 | 88.35% | — | Not clearly stated | Official page, checked Aug. 6, 2026 |
| University of St. Augustine for Health Sciences — MS Speech-Language Pathology — Dallas cohort | TX | 2024–2025 105/118; 2023–2024 58/64; 2022–2023 55/64 | 218/246 | 88.62% | — | Not clearly stated | Official page, checked Aug. 6, 2026 |
| University of Tennessee Health Science Center — MS Speech-Language Pathology | TN | 2025–2026 41/41; 2024–2025 42/42; 2023–2024 40/40 | 123/123 | 100% | 100% | Not clearly stated | Official page, checked Aug. 6, 2026 |
| University of Texas at Austin — MS Speech, Language, and Hearing Sciences / SLP | TX | 2025–2026 17/18; 2024–2025 20/20; 2023–2024 17/17 | 54/55 | 98.18% | 98% | Not clearly stated | Official page, checked Aug. 6, 2026 |
| University of Utah — MS Speech-Language Pathology | UT | 2026 14/14; 2025 47/48; 2024 32/32 | 93/94 | 98.94% | 99% | Not clearly stated | Official page, checked Aug. 6, 2026 |
| University of Virginia — MEd Communication Sciences and Disorders / SLP ‡ | VA | 2025–2026 31/31; 2024–2025 23/23; 2023–2024 34/34 | 88/88 | 100% | 100% | Not clearly stated | Official page, checked Aug. 6, 2026 |
| University of Washington — MS Speech-Language Pathology | WA | 2025 46/46; 2024 31/31; 2023 37/37 | 114/114 | 100% | 100% | Not clearly stated | Official page, checked Aug. 6, 2026 |
| Utah State University — MA/MS Speech-Language Pathology — main campus | UT | 2025–2026 18/18; 2024–2025 21/21; 2023–2024 20/20 | 59/59 | 100% | 100% | Not clearly stated | Official page, checked Aug. 6, 2026 |
| Utah State University — MA/MS Speech-Language Pathology — outreach distance | UT | 2025–2026 5/5; 2024–2025 5/5; 2023–2024 5/5 | 15/15 | 100% | 100% | Not clearly stated | Official page, checked Aug. 6, 2026 |
| Valdosta State University — MEd Communication Disorders / SLP | GA | 2025–2026 44/50; 2024–2025 51/61; 2023–2024 58/77 | 153/188 | 81.38% | 81% | Not clearly stated | Official page, checked Aug. 6, 2026 |
| Western Carolina University — MS Communication Sciences and Disorders / SLP | NC | 2025–2026 26/27; 2024–2025 25/29; 2023–2024 20/22 | 71/78 | 91.03% | 91% | Attempts not factored | Official page, checked Aug. 6, 2026 |
| Western Kentucky University — MS Speech-Language Pathology — distance component | KY | 2025–2026 51/59; 2024–2025 39/45; 2023–2024 36/45 | 126/149 | 84.56% | 85% | Not clearly stated | Official page, checked Aug. 6, 2026 |
| Western Kentucky University — MS Speech-Language Pathology — residential component | KY | 2025–2026 13/20; 2024–2025 21/22; 2023–2024 18/23 | 52/65 | 80% | 80% | Not clearly stated | Official page, checked Aug. 6, 2026 |
| Western Washington University — MS Speech-Language Pathology | WA | 2024–2025 19/19; 2023–2024 18/18; 2022–2023 21/21 | 58/58 | 100% | 100% | Not clearly stated | Official page, checked Aug. 6, 2026 |
Source: every row links to the official school or program page. Counts were copied and recalculated by Castleport Test Prep and checked August 6, 2026. Each period is shown as passed/took.
† Arithmetic flag: the school-posted three-period percentage differs from the visible raw-count result by at least 0.5 percentage point. This is Castleport’s review threshold, not a CAA rule.
‡ Derived value: the University of Virginia page shows taker counts and 100% rates but no separate passer column. Passers were set equal to takers and marked as derived in the dataset.
How the 56 records are spread out
| Measure | Result |
|---|---|
| Lowest recalculated rate | 74.82% |
| Highest | 100% |
| Median | 95.98% |
| Simple average across records | 94.31% |
| Records at exactly 100% | 15 |
| Records at 95% or above | 31 |
| Records at 96.0% or above | 28 — exactly half |
| Records below 90% | 10 |
| Records below CAA’s 80% threshold | 2 |
| Smallest group behind a rate | 15 test-taker records |
| Largest group | 501 |
| Median group size | 79 |
Source: Castleport audit of 56 program or delivery-mode records from 47 official program pages, verified August 6, 2026.
Most records sit high. Half are at 96.0% or above. That is the most important thing to understand about this data: it clusters near the ceiling, so it separates almost nobody.
Which programs reported 100%?
Fifteen records showed 100% across all three visible periods. The group size sits next to every one, because that is the part that changes what the number means.
| Program or delivery mode | State | Passed/took | Rate |
|---|---|---|---|
| University of Tennessee Health Science Center — MS Speech-Language Pathology | TN | 123/123 | 100% |
| University of Washington — MS Speech-Language Pathology | WA | 114/114 | 100% |
| University of South Carolina — MS Speech-Language Pathology — residential component | SC | 105/105 | 100% |
| Appalachian State University — MS Speech-Language Pathology | NC | 98/98 | 100% |
| University of Virginia — MEd Communication Sciences and Disorders / SLP | VA | 88/88 | 100% |
| University of Arizona — MS Speech-Language Pathology | AZ | 79/79 | 100% |
| Calvin University — MA Speech-Language Pathology — residential component | MI | 78/78 | 100% |
| University of Illinois Urbana-Champaign — MA Speech-Language Pathology | IL | 73/73 | 100% |
| University of Massachusetts Amherst — MA Speech-Language Pathology | MA | 66/66 | 100% |
| Utah State University — MA/MS Speech-Language Pathology — main campus | UT | 59/59 | 100% |
| Western Washington University — MS Speech-Language Pathology | WA | 58/58 | 100% |
| Idaho State University — MS Speech-Language Pathology — Meridian | ID | 48/48 | 100% |
| Idaho State University — MS Speech-Language Pathology — online | ID | 39/39 | 100% |
| Idaho State University — MS Speech-Language Pathology — Pocatello | ID | 31/31 | 100% |
| Utah State University — MA/MS Speech-Language Pathology — outreach distance | UT | 15/15 | 100% |
Source: official program outcome pages. Counts recalculated by Castleport from each page’s visible numbers, verified August 6, 2026.
This is not a “best programs” list. A 100% rate built on 15 records is not the same evidence as a 100% rate built on 123. Change one result in the 15-record group and it becomes 93.3%. Change one in the 123-record group and it becomes 99.2%. Same one-result change, very different drop.
Most pages do not give a clear attempt label
This was the clearest definition gap in the audit.
Only Cleveland State plainly labels its table “first attempt.” Western Carolina says attempts are not factored into its calculation. The other 54 records do not give a comparably clear first-attempt, highest-score, or eventual-pass label.
That missing sentence makes cross-school comparison unsafe. Two schools can post 95% and mean different things.
Fifteen of the 56 records post no formal three-period figure at all. That omission alone is allowed. CAA requires the three individual periods, not a combined percentage. But any combined figure a school chooses to post must be accurate.
Same school, different delivery mode, different result
Eight schools in the audit separate more than one program mode or campus.
| School | Mode A | Mode B | Absolute gap |
|---|---|---|---|
| Baylor University | On-campus 95.45% (189/198) | Online 90.22% (452/501) | 5.23 pts |
| Western Kentucky University | Residential 80.00% (52/65) | Distance 84.56% (126/149) | 4.56 pts |
| Calvin University | Residential 100% (78/78) | Distance 96.55% (56/58) | 3.45 pts |
| University of South Carolina | Residential 100% (105/105) | Distance 97.78% (88/90) | 2.22 pts |
| Adelphi University | Residential 74.82% (104/139) | Satellite 76.67% (23/30) | 1.85 pts |
| University of St. Augustine | Hybrid Austin 88.35% (220/249) | Hybrid Dallas 88.62% (218/246) | 0.27 pts |
| Idaho State University | Meridian, Pocatello, and online all 100% | — | 0 pts |
| Utah State University | Main campus 100% (59/59) | Distance 100% (15/15) | 0 pts |
Source: official program outcome pages, recalculated by Castleport, verified August 6, 2026.
Western Kentucky’s distance result is higher than its residential result. Online or distance delivery does not automatically mean a lower rate.
Baylor’s online program has the largest group in the entire audit: 501 test-taker records. Its 90.22% rests on more records than any 100% row above.
Why can a school’s posted rate differ from its own numbers?
A posted percentage and the counts printed above it are separate fields, and they do not always agree. We found four three-period figures that were at least half a point apart.
CAA is specific about the method. Add the raw counts across the three periods and divide. Do not average the three yearly percentages.
three-period rate = total passed across three periods ÷ total who took across three periods × 100
| Program | Counts shown | School-posted rate | Rate from the counts | Difference |
|---|---|---|---|---|
| Howard University — MS SLP | 13/16 | 85% | 81.25% | 3.75 pts |
| Arkansas State University — MCD / SLP | 74/79 | 90% | 93.67% | 3.67 pts |
| Cleveland State University — MA SLP | 86/95 | 93% | 90.53% | 2.47 pts |
| New York Medical College — MS SLP | 85/89 | 94.90% | 95.51% | 0.61 pts |
Source: official program outcome pages. Castleport recalculated each figure from the page’s visible taker and passer counts, checked August 6, 2026.
Worked example: New York Medical College shows 29 of 31, then 21 of 23, then 35 of 35.
(29 + 21 + 35) ÷ (31 + 23 + 35) = 85 ÷ 89 = 95.51%
The page posts 94.90%.
Three of the four gaps are a full point or more. Two run in the school’s own disfavor. Arkansas State posts 90% even though its visible counts produce 93.67%.
We are not guessing why a number differs. A page could be using an older total, a different time window, or a rule it does not describe. This is an arithmetic check, not a finding about accreditation compliance.
One yearly row also fails a direct check
The University of Texas at Austin page shows 17 passed out of 18 as 99.44%. The direct calculation is 94.44%. Its posted three-period figure of 98% is close to the raw-count result of 98.18%, so this looks like one annual-row error, not a different three-period method.
CAA has flagged public-information problems for years
CAA publishes yearly summaries of the standards that appeared most often in its reviews. Standard 1.9 covers public information broadly: the accreditation statement, student outcome data, labels, recency, and other public facts.
Standard 1.9 appears on CAA’s published most-cited lists from 2018 through 2022. In 2018, CAA said almost half of annual-report programs were cited under that standard and that the bulk involved incomplete or inaccurate student achievement data. In 2019 through 2021, CAA described about a third of annual-report programs each year.
That is important context. But Standard 1.9 is broader than Praxis arithmetic, so it cannot be turned into a count of wrong Praxis percentages.
CAA changed its process in spring 2022. Staff began warning programs about public-information concerns before the formal review and giving them chances to fix the page. Standard 1.9 then disappears from the published most-cited lists after 2022. That process change can affect what reaches the final list; it does not prove that every public table became accurate.
How often does the 80% rule appear in CAA’s published trends?
Standard 5.6 appears on CAA’s published most-cited lists in three of eight years: 2022, 2024, and 2025. In 2025, it appeared on both the application-review and annual-report lists.
| Year | Application reviews | Annual reports reviewed | Standard 1.9 on a published most-cited list? | Standard 5.6 on a published most-cited list? | Programs placed on probation |
|---|---|---|---|---|---|
| 2018 | 58 | 243 | Yes — application and annual-report lists | No | 2 |
| 2019 | 47 | 242 | Yes — application and annual-report lists | No | 2 |
| 2020 | 41 | 239 | Yes — application and annual-report lists | No | 2 |
| 2021 | 76 | 241 | Yes — application and annual-report lists | No | 4 |
| 2022 | 76 | 241 | Yes — application and annual-report lists | Yes — annual-report list | 23 |
| 2023 | 55 | 280 | No | No | 6 |
| 2024 | 50 | 255 | No | Yes — annual-report list | 2 |
| 2025 | 81 | 241 | No | Yes — both lists | 5 |
Sources: CAA Standards Compliance Trends summaries for 2018, 2019, 2020, 2021, 2022, 2023, 2024, and 2025. Compiled by Castleport and verified August 6, 2026. The cited-standard lists combine audiology and SLP programs.
These are published most-cited lists, not full counts of every Standard 5.6 citation. The one clean exception is the 2025 application-review list: CAA says each listed standard was cited once, and only four programs received any noncompliance citation from the 81 application reviews.
Three inconsistencies in CAA’s own summaries
We report these as observations. We assign no cause.
- 2025: CAA states 81 application reviews, then lists 18 audiology plus 75 SLP reviews. Those profession counts add to 93.
- 2022: CAA states that it reviewed 241 annual reports, then says 265 programs were continued on the basis of an annual-report review.
- 2021 and 2022: all six headline review counts are identical: 76 total applications, 13 audiology, 63 SLP, 241 annual reports, 55 audiology, and 186 SLP. The SLP annual-report count is also 186 in four straight years, 2019 through 2022.
None of those differences changes which years list Standard 5.6. They do matter for anyone reusing the totals.
Does a high pass rate mean a program is in good standing?
No. A school’s pass-rate page and its CAA accreditation status are two separate public records. Check both.
As of August 6, 2026, CAA’s current SLP listing shows eight master’s programs as accredited on probation. Five of the eight have Standard 5.6 named in the current listing. Three do not.
| SLP master’s program | State or territory | Current status decision | Standard or note shown in the current listing |
|---|---|---|---|
| Adelphi University | NY | Placed on probation Feb. 13, 2026 | Standard 5.6 — Praxis pass rate |
| Carlos Albizu University | PR | Continued probation June 17, 2026 | Standard 5.6 — Praxis pass rate |
| Gannon University, Ruskin | FL | Placed on probation May 28, 2026 | Standard 2.3 — faculty qualifications |
| Inter American University of Puerto Rico | PR | Continued probation Feb. 13, 2026 | Standards 5.5 and 5.6 — completion and Praxis pass rates |
| South Carolina State University | SC | Continued probation June 17, 2026 | Standard 5.6 — Praxis pass rate |
| Stephen F. Austin State University | TX | Placed on probation May 28, 2026 | Standard 2.3 — faculty qualifications |
| SUNY at Cortland | NY | Continued probation June 17, 2026 | Latest listing says the program met all standards and student-outcome thresholds |
| Texas A&M University–Kingsville | TX | Placed on probation Feb. 13, 2026 | Standard 5.6 — Praxis pass rate |
Source: CAA’s current SLP program listing, checked August 6, 2026.
“Accredited on probation” still means accredited. It does not mean the Praxis rate caused the status unless CAA names Standard 5.6.
A current action report with a number
CAA’s June 17, 2026 action report for Carlos Albizu University states that the program’s three-year Praxis pass rate is 69%. The report says the trend is positive but the rate remains below the 80% threshold, so CAA continued probation under Standard 5.6.
Source: CAA Accreditation Action Report, Carlos Albizu University, June 17, 2026.
Where the two public records meet
Adelphi University is the clearest program in this dataset where we can read both the school page and the CAA action report.
The current public outcome page shows these residential counts:
| Period | Took | Passed | Rate |
|---|---|---|---|
| 2023–2024 | 52 | 30 | 57.7% |
| 2024–2025 | 64 | 55 | 85.9% |
| 2025–2026 | 23 | 19 | 82.6% |
| Three-period total | 139 | 104 | 74.8% |
Source: Castleport Research audit, verified August 6, 2026.
Its satellite component shows 23 passes in 30 test-taker records, or 76.7%.
CAA’s February 13, 2026 report says the 2025 annual report produced a 76% three-year rate, after 79.5% the prior year, and that this repeated Standard 5.6 problem caused probation. The school’s August 2026 public table is a newer window, so its 74.8% is not the same source period as CAA’s 76%.
Sources: Adelphi’s official outcome page and CAA’s February 13, 2026 action report, checked August 6, 2026.
There is also a detail the combined number hides, and it runs in the program’s favor: the residential yearly trend is 57.7%, then 85.9%, then 82.6%. The latest two rows are above 80% on their own. The oldest row is what pulls the current three-period result below 80%.
Can SLP program pass rates be compared fairly?
Only between rows built under the same rules. Check the delivery mode, reporting periods, denominator, passer count, and attempt label first.
- Delivery mode. CAA requires separate data for residential, distance, and satellite parts covered by the accreditation.
- Reporting periods. A Praxis period is a testing cycle, not a graduating class. Two schools may show different three-year windows.
- Number who took it. A percentage with no denominator cannot be checked.
- Number who passed. Raw counts let a reader redo the math.
- Attempt label. Most pages in this audit do not clearly say first attempt, highest score, or eventual pass.
CAA says it reviews each program individually, not against other programs’ data. We publish no best-program list. The data cannot carry one.
Is the pooled audit figure a national rate?
No. Across all 56 records, the pooled count is 5,086 passes in 5,451 test-taker records, or 93.30%.
We publish it so the dataset can be checked. It is not a national average and must not be used as one. The schools were not selected at random. They qualified because a public page showed three usable periods with whole-number taker and passer counts. The periods and definitions also differ.
The pooled 93.30% happens to sit close to the national highest-score-only rate of 94.1% and far from the all-score rate of 83.0%. That is consistent with many program tables behaving more like person-level or highest-score data than all-score data. It is not proof. A nonrandom public-page audit cannot settle the question.
What score do you need to pass the SLP Praxis?
For ASHA certification, the passing score is 162 on a 100–200 scale. The current SLP test code is 5331.
- ASHA’s Council for Clinical Certification sets the passing score.
- A state licensing board may set a different requirement, so check the state rule too.
- ASHA does not accept scores more than five years old for certification.
- ETS allows retakes, but a test taker must wait at least 28 days after the prior test date.
The 5342 and 0342 codes sometimes shown next to a passing score of 170 are old audiology codes, not old SLP codes.
This page is about public pass-rate data. It does not replace current rules from ASHA, ETS, a state licensing board, or a graduate program.
Sources: ASHA, Praxis Scores and Score Reports; ASHA, About the SLP Praxis Exam; ETS, ASHA requirements; ETS retest policy.
What does CAA require programs to publish?
Programs must publish three recent periods of Praxis results on their own website, with raw taker and passer counts, clear labels, and separate tables for covered delivery modes.
| Requirement | Status |
|---|---|
| Post student outcome data on the program website | Required |
| Label it “Student Achievement Data” or “Student Outcome Data” | Required since August 1, 2017 |
| Show the three most recently completed academic years or reporting cycles | Required |
| Show number taking, number passing, and pass percentage for each period | Required |
| Report each covered delivery mode separately | Required |
| Update the public data | At least annually |
| Post a combined three-period percentage | Not required — but it must be accurate if posted |
| Post an employment rate | Not required beginning January 1, 2023 |
Sources: CAA, Public Information; CAA, Presenting Student Achievement Data; CAA, Student Achievement Measures; CAA, Calculating Three-Year Rates. Verified August 6, 2026.
The January 1, 2023 date belongs to the end of the employment-rate publication requirement. It is not a yearly deadline for updating Praxis data.
How was this dataset built?
We read official ASHA reports for the national figures, official program pages for the school figures, and CAA’s own rules for the method. Then we recalculated every result from the raw counts.
National figures
The two national series come from ASHA’s official SLP Praxis reports:
- one report includes all score records from repeat test takers;
- the other keeps only the highest score for each person.
Both cover people who identified ASHA as a score recipient. We transcribed all 11 years, recalculated all 22 rates, and computed the gap for each year. Every percentage matches its own published count after rounding.
Program figures
A record was included when:
- the source was an official school or program page;
- the page showed three usable reporting periods;
- every period had a whole-number count who took and a count who passed;
- the row clearly referred to an SLP master’s program or a named delivery mode;
- separate residential, online, distance, satellite, and campus tables stayed separate.
A record was excluded when:
- fewer than three usable periods were visible;
- whole-number passer counts could not be recovered;
- the page made a broad claim without a usable table;
- the data could not be tied to a specific SLP program or mode.
Four incomplete records were logged in the source work: Northeastern University’s Charlotte satellite, Maryville University’s online program, Mount St. Joseph University, and Saint Xavier University. Each lacked enough usable whole-number periods for this release.
One included record has a derived value. The University of Virginia page shows taker counts and 100% rates but no separate passer column, so passers were set equal to takers. That row is marked in the dataset.
The calculation
For each record:
sum of passers across three periods ÷ sum of takers across three periods × 100
Rates were rounded to two decimals. A school-posted combined figure was flagged when it differed by 0.5 percentage point or more from the raw-count result.
That 0.5-point flag is Castleport’s review threshold. It is not a CAA enforcement rule.
The check on the check
Before publication, all 56 records were re-derived from their period-level counts. All 56 reproduced.
| Reproducibility item | Value |
|---|---|
| Dataset version | 1.0 |
| Program CSV SHA-256 | 5fde962bfedc226358ba36cc9e3327fcfe56d0e0b9a2d1b9feeea7531b0e023d |
| National-series CSV SHA-256 | 4d000d6883eacf2c476961e538774c168968a12937b020828fed4bff3000c5fd |
| Program records | 56 |
| Institution pages | 47 |
| Verification date | August 6, 2026 |
Source: Castleport Research audit, verified August 6, 2026.
The hashes let a researcher confirm that a downloaded file is the same version used for this page.
Who made this and why
Castleport Test Prep Editorial Team produced this page from official ASHA, CAA, ETS, and university sources. The facts were public but scattered across two national reports, eight accreditor summaries, a live accreditation listing, action reports, and dozens of school pages. Putting them in one dated dataset makes the math checkable.
Castleport Test Prep is not affiliated with ASHA, CAA, ETS, or any school named here.
What this data shows, and what it does not
It shows what 47 schools published, what those counts produce under one formula, and how two official national counting rules change the headline rate. It does not show that one school teaches better than another.
It shows
- Two official national rates for the same exam year, side by side, with an 11-year series.
- 56 program or delivery-mode records from 47 schools across 26 states and Washington, D.C.
- Three visible periods and raw counts for every included record.
- A recalculated rate using pooled raw counts.
- Four school-posted figures that differ from the visible counts by at least half a point.
- Eight years of CAA’s published compliance-trend summaries.
- Eight SLP master’s programs listed as accredited on probation on August 6, 2026.
- A source URL and verification date for every program record.
It does not show
- Every SLP program in the United States.
- A random or nationally representative sample.
- One shared first-attempt rate.
- Unique people across program periods.
- A measure of teaching quality.
- A grade or “best programs” list.
- A compliance finding for any school based only on Castleport’s arithmetic.
- A cause for any pattern in the data.
What are the limits of this research?
The audit is broad but incomplete, and the source data is not uniform. Careful arithmetic does not remove those limits.
- The program audit is not a census. It covers pages that exposed three usable periods with raw counts.
- The sample is not random. Programs with clear public tables may differ from programs with missing or incomplete pages.
- The CAA trend series records whether a standard appeared on a published most-cited list. Except for the one-count detail CAA gives for the 2025 application list, it is not a count of individual citations.
- CAA’s cited-standard lists combine audiology and SLP. The review totals are split by profession; the standards lists are not.
- Program pages change. Each three-period window moves over time, and a page may update after this verification date.
- A probation status says nothing about Praxis unless CAA names Standard 5.
- The two ASHA national reports do not fully reconcile in three of eleven year
- The 0.5-point arithmetic flag is Castleport’s threshold. It carries no regulatory meaning.
- The attempt definition is usually unclear. Only one record plainly says first attempt, and one more says attempts are not factored.
- This page identifies patterns and arithmetic differences. It does not establish cause
How to cite this page
Suggested citation: Castleport Test Prep Editorial Team. “SLP Praxis Pass Rates by Program: 2026 Data From 47 Schools.” Castleport Research. Dataset version 1.0. Last verified August 6, 2026. https://castleporttestprep.com/research/slp-praxis-pass-rates-by-program
Publisher: Castleport Test Prep Dataset version: 1.0 Verification date: August 6, 2026 Coverage: 56 program or delivery-mode records from 47 institutions across 26 states and Washington, D.C.; an 11-year national series; and an eight-year CAA compliance-trend series. Not a national census.
National figures are ASHA’s. Reporting rules and accreditation records are CAA’s. Test requirements are ASHA’s and ETS’s. The compilation, normalized comparison fields, recalculation, and arithmetic review are Castleport’s.
Frequently asked questions
What is the average SLP Praxis pass rate?
There is no single number unless you name the counting rule. ASHA’s 2024–25 all-score report gives 83.0%. Its highest-score-only report gives 94.1%. Both are official, and both describe the same 8,639 passes among people who named ASHA as a score recipient.
Why do some sources say 83% and others say 94%?
They are quoting ASHA’s two different reports. The 83.0% figure counts all 10,410 score records, including repeat scores. The 94.1% figure counts 9,177 people and keeps only each person’s highest score.
Is the 83% national rate a first-attempt pass rate?
No. ASHA calls it an all-score rate. It includes every score record in the report, including multiple scores from repeat test takers. The report does not publish a separate first-attempt rate.
Are program Praxis pass rates first-attempt rates?
Usually the page does not say. Cleveland State plainly labels its table first attempt. Western Carolina says attempts are not factored into its calculation. The other records in this audit do not give a comparably clear first-attempt, highest-score, or eventual-pass label.
Which SLP programs have a 100% Praxis pass rate?
Fifteen records in this audit showed 100% across three visible periods, with group sizes from 15 to 123 test-taker records. The full list is above. This audit does not cover every program, and it is not a best-program list.
Does a 100% pass rate mean a program is better?
No. Group size, time period, delivery mode, attempt rule, and who appears in the data all change the number. CAA says it reviews each program on its own, not against other programs’ data.
What happens if a program falls below 80%?
CAA can cite Standard 5.6 and require an explanation and improvement plan. If the same problem remains after a second consecutive report, CAA may place the program on probation or withdraw accreditation. As of August 6, 2026, five of the eight SLP master’s programs listed on probation had Standard 5.6 named in the current listing.
Can I check whether a program is in good standing?
Yes. Check the current CAA program listing separately from the school’s pass-rate page. A program listed as accredited on probation is still accredited, but the listing shows the decision date and any standard CAA currently names.
How many people took the SLP Praxis in 2024–25?
ASHA’s highest-score-only report lists 9,177 people who named ASHA as a score recipient. Its all-score report lists 10,410 score records because one person can have more than one score in that report.
Why is my program missing from the table?
This is a 56-record public-page audit, not a full national count. A program may not have surfaced in this release, may show fewer than three usable periods, or may publish percentages without whole-number passer counts.
How often is this data updated?
The program dataset gets a full source recheck once a year, with link checks each quarter. The national series updates when ASHA posts new reports. The visible verification date changes only after the sources are checked again.
Primary sources
National exam data
- ASHA, National Summary Report for Praxis Data in Speech-Language Pathology — all score records
- ASHA, National Summary Report for Praxis: Highest Score Speech-Language Pathology
- ASHA, Praxis Scores and Score Reports
- ASHA, About the Speech-Language Pathology Praxis Exam
- ETS, ASHA certification requirements for Praxis 5331
- ETS, Praxis retest policy
Accreditation rules and records
- CAA, Student Achievement Measures
- CAA, Presenting Student Achievement Data
- CAA, Documenting Compliance
- CAA, Calculating Three-Year Rates
- CAA, Usage of Student Achievement Data
- CAA, Public Information
- CAA, Standards Compliance Trends, 2018–2025
- CAA, current SLP program listing
- CAA, Carlos Albizu University action report, June 17, 2026
- CAA, Adelphi University action report, February 13, 2026
Program pages
All 47 official program source URLs, the rows each source supports, and the date checked appear in the source manifest. The complete live-link list also appears in the 56-row table above.