By the Castleport Test Prep Editorial Team Published: August 5, 2026 · Last verified: August 5, 2026
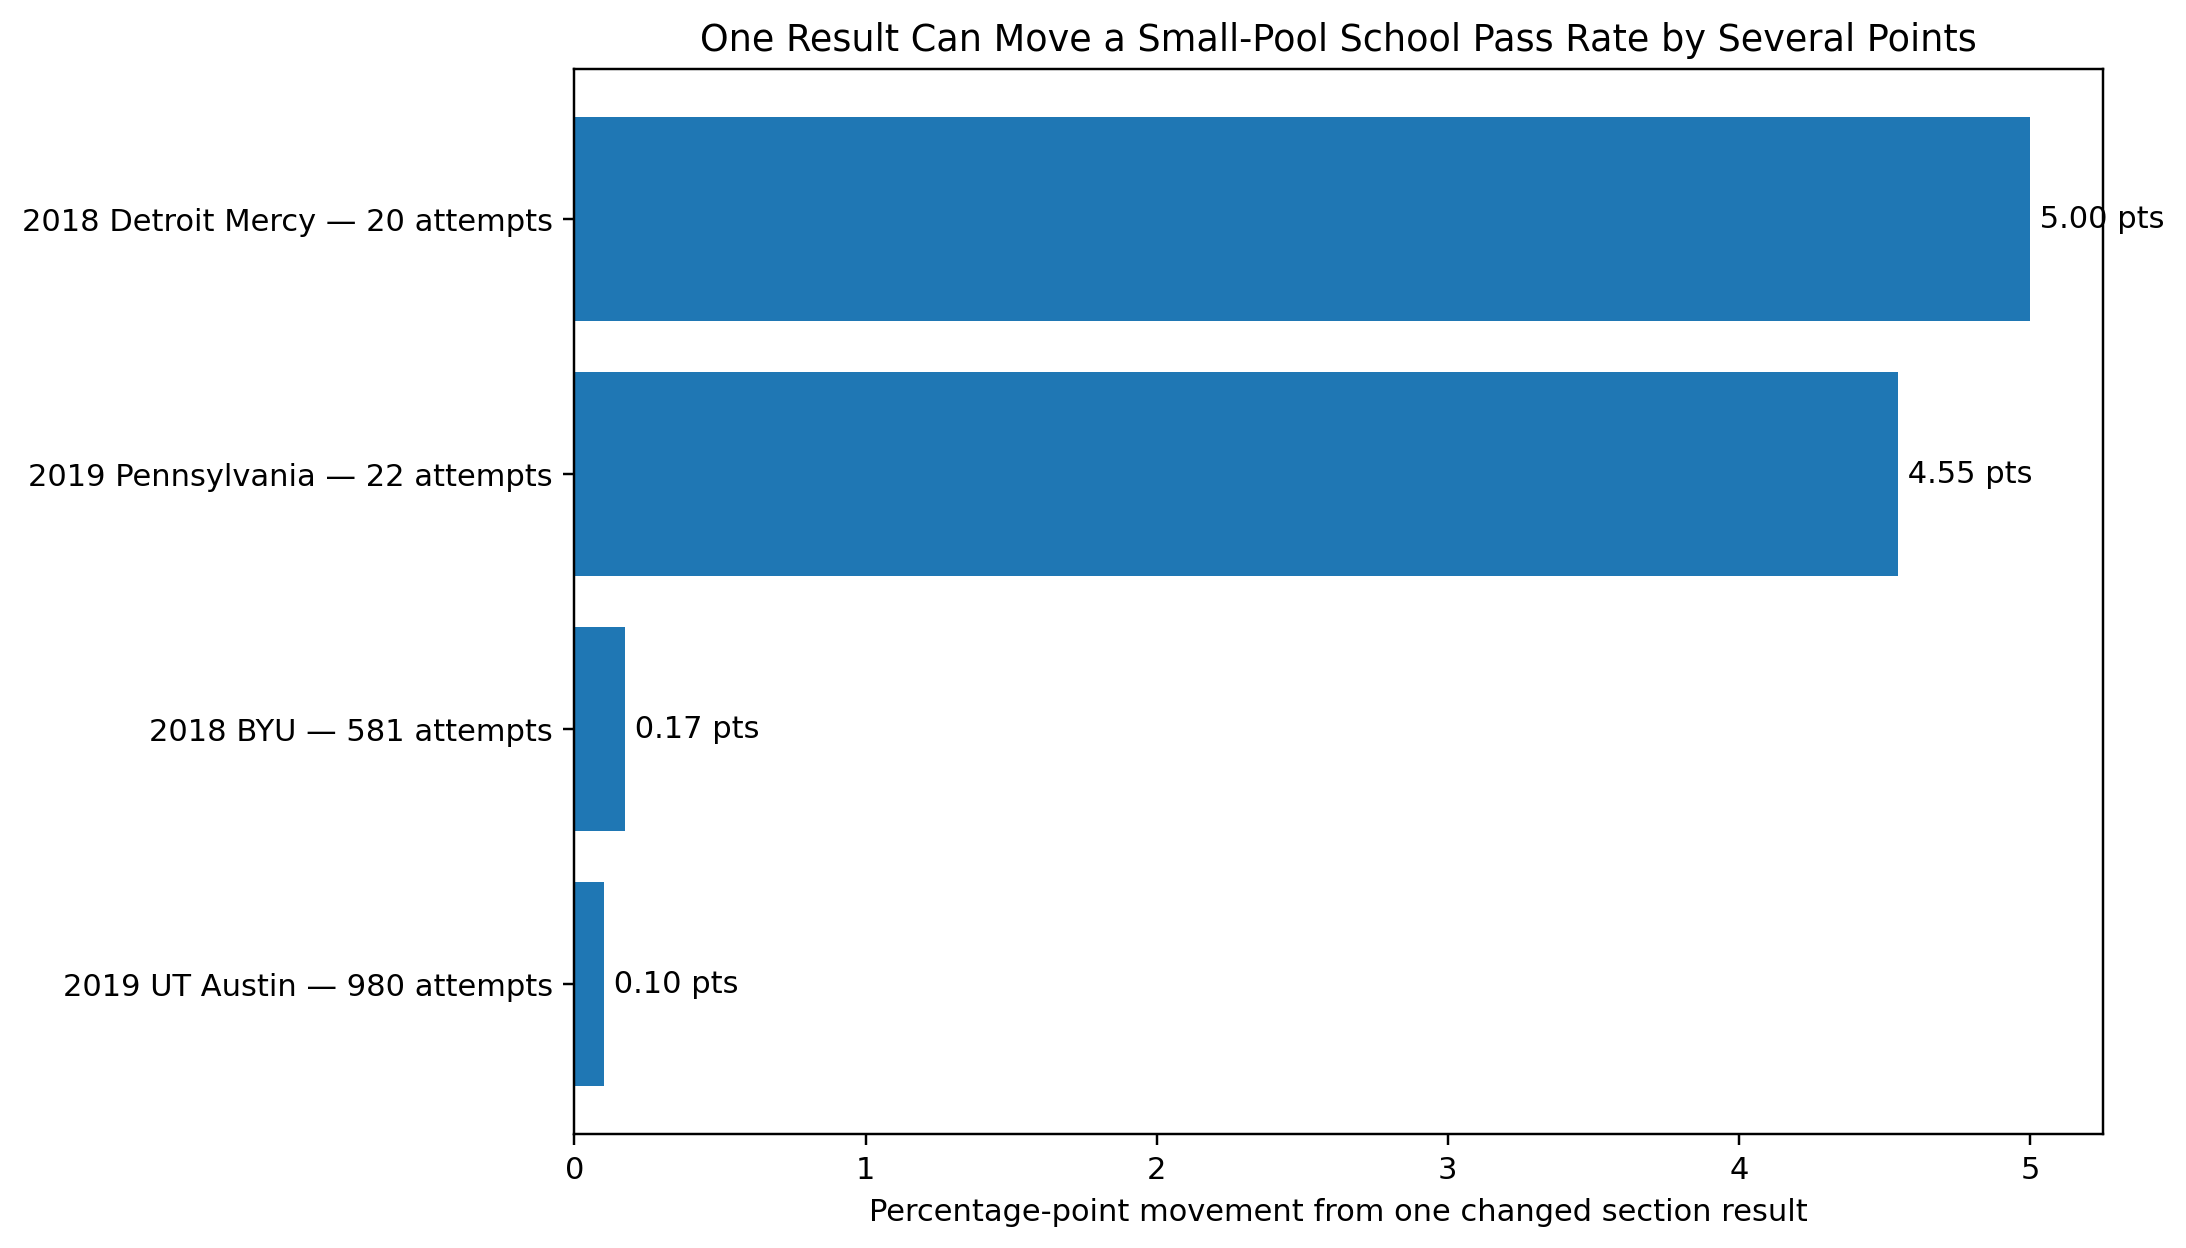
The number to quote: CPA Exam pass rates by school are only as useful as the denominators behind them. Across 41 top-ten entries in four publicly accessible NASBA tables from 2015, 2016, 2018 and 2019, 17 entries—41%—had 30 or fewer first-time candidates, and 13—32%—had 20 or fewer. Penn’s 2019 figure of 90.9% corresponds to 20 passed first-time sections out of 22; changing one result would have moved the rate to 86.4%, matching the displayed rate of the two schools tied for tenth.
| 2019 school | Position | Candidates | Section attempts | Pass rate | One-result sensitivity |
|---|---|---|---|---|---|
| University of Pennsylvania | 1 | 11 | 22 | 90.9% | 4.55 pts |
| University of Texas at Austin | 3 | 358 | 980 | 89.5% | 0.10 pts |
Source: NASBA’s Fall 2020 State Board Report, p. 8. School figures are NASBA’s. Candidate and attempt multiples, implied passed sections and one-result sensitivity are Castleport Test Prep calculations. Verified August 5, 2026.
UT Austin sat 1.4 percentage points behind Penn with 32.5 times as many candidates and 44.5 times as many section attempts. Those rates appear in the same column, but their denominators are not remotely alike.
NASBA’s own warning is blunter than ours:
“the overall Institution results may not be the best indication of university performance.”
That is not a critic talking. It is NASBA’s note on page 1 of its 2015 University Edition.
This page publishes a verified 101-row dataset from four named official tables, keeps every candidate and section denominator visible, adds a reproducible one-result sensitivity field, and separates historical school figures from the current national section rates. It does not pretend those 101 rows are every institutional table NASBA has ever made public, and it does not manufacture a current school comparison from a paid report we have not reproduced.
Data files: 101-row CSV · Original sensitivity chart
Is there a current public list of CPA Exam pass rates by school?
Among the official NASBA materials reviewed for this page, the latest free national table that actually prints school pass rates is the 2019 excerpt. Paid editions now cover 2020 through 2024, but NASBA’s public announcements for the later editions name schools with the largest candidate pools rather than publishing a free current table of school pass rates.
NASBA’s 2019 edition contained section-by-section performance for 1,117 schools and identified 758 institutions with at least 10 reported candidates. The free excerpt printed 11 rows through position 10 because two positions were ties. Those 11 rows equal 0.98% of the 1,117 schools with section-level data in the book.
The 2024 release says the paid edition contains detailed university analyses and costs $300. Its public announcement identifies the three universities with the largest first-time candidate pools—Illinois Urbana-Champaign, Baruch College CUNY and Cal State Fullerton—but does not print a free table of current school pass rates.
The AICPA publishes current national pass rates by Exam section for free. Those figures answer a different question: how candidates performed on AUD, FAR, REG, BAR, ISC and TCP nationally, not how one school performed.
The verified 101-row CPA Exam pass-rate dataset
This dataset contains 101 rows from four precisely defined official public tables: the 2015 and 2016 top-40 tables, the 2018 top-10 excerpt, and the 2019 table through position 10 including ties. It is a verified recent-history dataset, not a claim that these are the only institutional tables NASBA has ever published.
| Exam year | Official public table used here | Rows in dataset |
|---|---|---|
| 2015 | First-Time, All Programs; positions 1–40 | 40 |
| 2016 | First-Time, All Programs; positions 1–40 | 40 |
| 2018 | First-Time, All Programs; positions 1–10 | 10 |
| 2019 | First-Time, All Programs; through position 10, including ties | 11 |
| Total | 101 |
Source: Castleport Test Prep Research, “CPA Exam Pass Rates by School: What the Public Data Actually Says.” Verified August 5, 2026.
What is one-result sensitivity?
One-result sensitivity = 100 ÷ first-time section attempts. It is the percentage-point movement in the reported pass rate if exactly one section result changes while the denominator stays fixed.
It is not a confidence interval, a margin of error, a quality adjustment or a substitute for the official table. It shows the granularity of the denominator—the part that disappears when a school is reduced to one percentage.
2019 school table: the latest free national pass-rate excerpt reviewed
| Position | Institution | First-time candidates | First-time sections | Pass rate | One-result sensitivity |
|---|---|---|---|---|---|
| 1 | University of Pennsylvania | 11 | 22 | 90.9% | 4.55 pts |
| 2 | Rice University | 29 | 76 | 90.8% | 1.32 pts |
| 3 | University of Texas at Austin | 358 | 980 | 89.5% | 0.10 pts |
| 4 | Brigham Young University | 273 | 695 | 89.4% | 0.14 pts |
| 5 | Wake Forest University | 82 | 215 | 88.8% | 0.47 pts |
| 6 | Morningside College | 10 | 26 | 88.5% | 3.85 pts |
| 6 | Michigan Technological University | 11 | 26 | 88.5% | 3.85 pts |
| 8 | Boston College | 129 | 316 | 88.3% | 0.32 pts |
| 9 | University of Michigan-Ann Arbor | 77 | 195 | 88.2% | 0.51 pts |
| 10 | Georgetown University | 42 | 103 | 86.4% | 0.97 pts |
| 10 | University of Florida | 248 | 514 | 86.4% | 0.19 pts |
Source: NASBA State Board Report, Fall 2020, p. 8, reproducing the 2019 Edition table. Position, institution, candidate, section and pass-rate figures are NASBA’s. Sensitivity is Castleport Test Prep’s calculation: 100 ÷ sections.
Penn’s 90.9% corresponds to 20 passed sections out of 22. One changed result produces 19 ÷ 22 = 86.36%, displayed as 86.4%—the same printed rate as Georgetown and Florida, the two schools tied at position 10.
2018 school table
| Position | Institution | First-time candidates | First-time sections | Pass rate | Avg. score | One-result sensitivity |
|---|---|---|---|---|---|---|
| 1 | University of Detroit Mercy | 11 | 20 | 95.0% | 87.5 | 5.00 pts |
| 2 | Rice University | 30 | 76 | 90.8% | 86.3 | 1.32 pts |
| 3 | Emory University | 58 | 149 | 89.9% | 83.9 | 0.67 pts |
| 4 | Brigham Young University | 263 | 581 | 89.2% | 84.6 | 0.17 pts |
| 5 | University of Virginia | 78 | 173 | 89.0% | 85.2 | 0.58 pts |
| 6 | University of Wisconsin-Madison | 220 | 506 | 87.2% | 83.3 | 0.20 pts |
| 7 | University of North Carolina at Asheville | 11 | 23 | 87.0% | 81.9 | 4.35 pts |
| 8 | Beth Medrash Govoha | 17 | 28 | 85.7% | 79.5 | 3.57 pts |
| 9 | Georgetown University | 42 | 88 | 85.2% | 83.0 | 1.14 pts |
| 10 | University of Florida | 219 | 396 | 84.8% | 82.7 | 0.25 pts |
Source: NASBA State Board Report, October 2019, p. 1, excerpting the 2018 Edition. Sensitivity calculated by Castleport Test Prep.
Detroit Mercy’s 95.0% corresponds to 19 passed sections out of 20. One changed result produces 18 ÷ 20 = 90.0%, which would sit behind Rice’s 90.8% and ahead of Emory’s 89.9%—second, not third.
2016 school table
| Position | Institution | First-time candidates | First-time sections | Pass rate | Avg. score | One-result sensitivity |
|---|---|---|---|---|---|---|
| 1 | Wake Forest University | 92 | 286 | 89.5% | 84.0 | 0.35 pts |
| 2 | Northwestern University | 14 | 27 | 88.9% | 80.4 | 3.70 pts |
| 3 | University of West Florida | 17 | 31 | 87.1% | 81.6 | 3.23 pts |
| 4 | Illinois Institute of Technology | 10 | 21 | 85.7% | 84.2 | 4.76 pts |
| 5 | Northwestern College | 10 | 20 | 85.0% | 80.9 | 5.00 pts |
| 6 | University of Wisconsin-Madison | 245 | 648 | 84.7% | 82.9 | 0.15 pts |
| 7 | University of Florida | 138 | 358 | 84.6% | 82.0 | 0.28 pts |
| 8 | Brigham Young University | 317 | 773 | 84.6% | 83.1 | 0.13 pts |
| 9 | Dordt College | 20 | 44 | 84.1% | 81.4 | 2.27 pts |
| 10 | Messiah College | 28 | 80 | 83.8% | 82.5 | 1.25 pts |
| 11 | University of Notre Dame | 211 | 579 | 82.9% | 82.6 | 0.17 pts |
| 12 | University of Georgia | 314 | 795 | 82.3% | 82.1 | 0.13 pts |
| 13 | The Master's College and Seminary | 15 | 39 | 82.1% | 78.5 | 2.56 pts |
| 14 | Boston College | 188 | 484 | 81.8% | 82.0 | 0.21 pts |
| 15 | Truman State University | 49 | 164 | 81.1% | 81.2 | 0.61 pts |
| 16 | University of Missouri-Columbia | 141 | 426 | 80.8% | 81.7 | 0.23 pts |
| 17 | University of Virginia | 92 | 210 | 80.0% | 81.7 | 0.48 pts |
| 17 | Furman University | 16 | 45 | 80.0% | 81.4 | 2.22 pts |
| 17 | Beth Medrash Govoha | 32 | 70 | 80.0% | 79.3 | 1.43 pts |
| 20 | University of Texas at Austin | 413 | 1,049 | 80.0% | 81.4 | 0.10 pts |
| 21 | Saint Vincent College | 17 | 34 | 79.4% | 78.7 | 2.94 pts |
| 22 | University of Tennessee-Knoxville | 257 | 575 | 79.0% | 79.7 | 0.17 pts |
| 23 | University of Vermont | 49 | 126 | 78.6% | 80.5 | 0.79 pts |
| 24 | Duke University | 14 | 32 | 78.1% | 83.4 | 3.13 pts |
| 25 | University of Miami | 70 | 177 | 78.0% | 80.6 | 0.57 pts |
| 26 | Shippensburg University of Pennsylvania | 35 | 72 | 77.8% | 79.4 | 1.39 pts |
| 26 | Trinity University | 45 | 117 | 77.8% | 80.0 | 0.85 pts |
| 28 | University of Michigan-Ann Arbor | 121 | 324 | 77.2% | 81.4 | 0.31 pts |
| 29 | Texas A&M University | 398 | 1,196 | 77.1% | 80.1 | 0.08 pts |
| 30 | University of North Carolina at Chapel Hill | 136 | 367 | 76.8% | 80.4 | 0.27 pts |
| 31 | Lehigh University | 117 | 273 | 76.6% | 80.2 | 0.37 pts |
| 32 | Washington and Lee University | 41 | 113 | 76.1% | 80.9 | 0.89 pts |
| 33 | University of Richmond | 96 | 252 | 75.8% | 79.7 | 0.40 pts |
| 34 | Calvin College | 38 | 85 | 75.3% | 79.7 | 1.18 pts |
| 35 | University of Wisconsin-Oshkosh | 63 | 145 | 75.2% | 78.1 | 0.69 pts |
| 36 | Texas Christian University | 111 | 286 | 74.8% | 79.5 | 0.35 pts |
| 37 | College of the Holy Cross | 45 | 107 | 74.8% | 80.2 | 0.93 pts |
| 38 | University of Denver | 158 | 330 | 73.9% | 79.5 | 0.30 pts |
| 39 | Washington University in St. Louis | 71 | 170 | 73.5% | 80.5 | 0.59 pts |
| 40 | University of Nebraska-Lincoln | 111 | 246 | 73.2% | 78.4 | 0.41 pts |
Source: Candidate Performance on the Uniform CPA Examination — 2016 University Edition, p. 163. The official table covers First-Time, All Programs and includes institutions with at least 10 reported candidates. Sensitivity calculated by Castleport Test Prep.
In 2016, four of the first five entries had fewer than 20 first-time candidates: 14, 17, 10 and 10.
2015 school table
| Position | Institution | First-time candidates | First-time sections | Pass rate | Avg. score | One-result sensitivity |
|---|---|---|---|---|---|---|
| 1 | University of Pennsylvania | 25 | 53 | 90.6% | 84.2 | 1.89 pts |
| 2 | University of Georgia | 279 | 700 | 88.4% | 83.6 | 0.14 pts |
| 3 | Washington University in St. Louis | 61 | 145 | 86.9% | 83.0 | 0.69 pts |
| 4 | University of Florida | 116 | 262 | 85.5% | 83.5 | 0.38 pts |
| 5 | Northwestern University | 15 | 34 | 85.3% | 81.7 | 2.94 pts |
| 6 | Brigham Young University | 265 | 651 | 84.8% | 83.3 | 0.15 pts |
| 7 | University of Wisconsin-Madison | 202 | 510 | 84.5% | 83.3 | 0.20 pts |
| 8 | The Master's College and Seminary | 10 | 19 | 84.2% | 79.2 | 5.26 pts |
| 9 | University of Notre Dame | 207 | 592 | 84.1% | 82.9 | 0.17 pts |
| 10 | Vanderbilt University | 36 | 113 | 83.2% | 82.7 | 0.89 pts |
| 11 | Colorado Christian University | 12 | 23 | 82.6% | 82.2 | 4.35 pts |
| 12 | Wake Forest University | 92 | 321 | 82.6% | 82.1 | 0.31 pts |
| 13 | Boston College | 191 | 498 | 82.5% | 82.3 | 0.20 pts |
| 14 | Beth Medrash Govoha | 22 | 51 | 82.4% | 83.1 | 1.96 pts |
| 15 | University of Tennessee-Knoxville | 211 | 422 | 81.8% | 81.0 | 0.24 pts |
| 16 | Furman University | 19 | 62 | 80.7% | 81.7 | 1.61 pts |
| 17 | University of Virginia | 99 | 256 | 80.5% | 82.8 | 0.39 pts |
| 18 | University of Texas at Austin | 410 | 1,075 | 80.1% | 81.8 | 0.09 pts |
| 19 | Wisconsin Lutheran College | 11 | 25 | 80.0% | 76.8 | 4.00 pts |
| 20 | University of Missouri-Columbia | 172 | 535 | 79.6% | 81.7 | 0.19 pts |
| 21 | University of Iowa | 174 | 441 | 79.6% | 80.4 | 0.23 pts |
| 22 | University of Colorado Boulder | 132 | 279 | 79.2% | 80.2 | 0.36 pts |
| 23 | Lehigh University | 106 | 245 | 79.2% | 81.1 | 0.41 pts |
| 24 | Johns Hopkins University | 10 | 19 | 79.0% | 80.4 | 5.26 pts |
| 25 | Texas A&M University | 360 | 1,054 | 78.8% | 80.8 | 0.09 pts |
| 26 | Georgetown University | 48 | 107 | 78.5% | 81.8 | 0.93 pts |
| 27 | Texas Christian University | 73 | 169 | 78.1% | 79.9 | 0.59 pts |
| 28 | University of Michigan-Ann Arbor | 135 | 375 | 77.9% | 82.2 | 0.27 pts |
| 29 | Indiana University System | 74 | 215 | 77.7% | 80.7 | 0.47 pts |
| 30 | Truman State University | 39 | 137 | 77.4% | 79.8 | 0.73 pts |
| 31 | Davidson College | 12 | 38 | 76.3% | 79.9 | 2.63 pts |
| 32 | Emory University | 75 | 189 | 76.2% | 80.0 | 0.53 pts |
| 33 | Eastern New Mexico University | 14 | 25 | 76.0% | 75.5 | 4.00 pts |
| 34 | Cornell University | 35 | 79 | 76.0% | 80.0 | 1.27 pts |
| 35 | Duke University | 17 | 37 | 75.7% | 81.4 | 2.70 pts |
| 36 | University of Wisconsin-Oshkosh | 58 | 119 | 75.6% | 80.5 | 0.84 pts |
| 37 | University of Rochester | 36 | 77 | 75.3% | 79.5 | 1.30 pts |
| 38 | University of Oklahoma-Norman | 132 | 331 | 75.2% | 79.0 | 0.30 pts |
| 39 | University of Wisconsin-La Crosse | 81 | 157 | 75.2% | 78.9 | 0.64 pts |
| 40 | University of Vermont | 37 | 84 | 75.0% | 80.5 | 1.19 pts |
Source: Candidate Performance on the Uniform CPA Examination — 2015 University Edition, p. 163. The official table covers First-Time, All Programs and includes institutions with at least 10 reported candidates. Sensitivity calculated by Castleport Test Prep.
What do the candidate counts show?
The public tables do not merely show different school pass rates; they show denominators that differ by more than an order of magnitude inside the same top ten. Across the 41 top-ten entries in the four selected years, 17 (41%) had 30 or fewer candidates, 13 (32%) had 20 or fewer, and the median was 58 candidates.
This is arithmetic, not an accusation against any school. With 20 section attempts, one result moves the rate by 5 points. With 900 attempts, one result moves it by about 0.11 points. A table that orders schools by the visible percentage but hides the denominator erases that difference.
How does the small-program concentration change down the 2015 and 2016 tables?
Combining the two complete top-40 tables gives 80 rows. The share of entries with 30 or fewer candidates falls from 9 of 20 in positions 1–10 to 3 of 20 in positions 31–40.
| Position band, 2015 + 2016 combined | Entries | Entries with ≤30 candidates | Median candidates | Mean pass rate |
|---|---|---|---|---|
| Positions 1–10 | 20 | 9 | 48.5 | 85.78% |
| Positions 11–20 | 20 | 6 | 95.5 | 81.19% |
| Positions 21–30 | 20 | 3 | 73.5 | 78.26% |
| Positions 31–40 | 20 | 3 | 60.5 | 75.29% |
Source: Castleport Test Prep analysis of the official 2015 and 2016 tables. NASBA supplied the positions, candidate counts and rates; Castleport Test Prep calculated the bands, counts, medians and means. Means are rounded to two decimals using conventional half-up rounding.
What changes under a 50-candidate minimum?
Applying a 50-candidate minimum to the same official 2015 and 2016 rows excludes four of the original top ten in 2015 and six of the original top ten in 2016. The threshold is Castleport Test Prep’s demonstration, not a rule NASBA used and not a replacement school table.
| Year | Original top-10 entries excluded by a 50-candidate minimum | Schools excluded |
|---|---|---|
| 2015 | 4 of 10 | University of Pennsylvania, Northwestern University, The Master's College and Seminary, Vanderbilt University |
| 2016 | 6 of 10 | Northwestern University, University of West Florida, Illinois Institute of Technology, Northwestern College, Dordt College, Messiah College |
Source: Castleport Test Prep re-filtering of the official 2015 and 2016 top-40 tables. The calculation changes only the inclusion threshold; it does not alter any NASBA rate.
Six of the ten 2016 entries disappear under that single reporting rule. The answer is not a fixed fact about the schools. It changes when the denominator rule changes.
What does NASBA say about comparing schools?
NASBA tells readers to use institution results cautiously. Its 2015 University Edition says degree classifications can lag a candidate’s actual program, custom analysis using university graduation lists is more accurate, and the first-time-within-one-year view was missing a degree date for 27% of candidates.
The stated cautions on pages 1–2 include:
- Many candidates may be classified as bachelor’s students while enrolled in graduate programs because the application records completed degrees.
- Because of that classification issue, overall institution results may not be the best indication of university performance.
- University-provided graduation lists produce more accurate custom program analysis.
- In the first-time-within-one-year results, the degree date was missing for 27% of candidates.
- School missions and student demographics differ, so school results should be interpreted cautiously.
The 27% figure documents a limitation in the 2015 book’s education records. It does not establish the size or cause of the separate 2024 attribution problem discussed below.
What is “first-time within one year”?
The 2015 book also reports first-time sections taken within 365 days of graduation when a valid degree date exists. NASBA describes it as a tighter filter intended to associate performance more closely with the candidate’s most recent institution.
That is a different population from the main First-Time, All Programs table. Two figures for the same school and year can both be faithful to NASBA’s definitions while measuring different candidate groups.
Primary source: NASBA 2015 University Edition, “Note About This Edition” and “First-Time within one year”.
What happened to school-level CPA Exam data after 2019?
NASBA paused the Candidate Performance publication effective with the 2020 edition while it implemented CPA Evolution, then released the 2020–2023 paid editions in November 2024 and the 2024 paid edition in August 2025. The official public announcements restored access to paid university analyses but did not restore a free national school pass-rate table.
December 2021: the pause. NASBA said it had ceased publication effective with the 2020 edition because of the work required for CPA Evolution and changes to the National Candidate Database. Publications through 2019 remained available.
January 2022: accounting educators object. AACSB International and the American Accounting Association wrote jointly to NASBA, arguing that schools and students use the reports for external validation, curriculum review and school comparison.
November 2024: four editions return. NASBA released the 2020, 2021, 2022 and 2023 editions for purchase.
August 2025: the 2024 edition returns under the new Exam. NASBA released the first paid book covering the three Core sections and three Discipline choices and priced it at $300.
Primary sources: NASBA’s 2021 pause notice, NASBA’s 2020–2023 release, AACSB/AAA’s 2022 letter and NASBA’s 2024-edition release.
What did the University of Northern Iowa reconciliation find?
Joseph Ugrin reported a candidate-by-candidate reconciliation performed by the University of Northern Iowa and NASBA’s data team for UNI’s 2024 candidates. Of 61 active candidates, 28—45.90%—were absent from UNI’s university results; Ugrin wrote that NASBA confirmed where those records appeared.
| University of Northern Iowa, 2024 candidates | Count | Share of 61 |
|---|---|---|
| Active candidates reviewed | 61 | 100% |
| Absent from UNI’s NASBA results | 28 | 45.90% |
| Listed under a community college | 19 | 31.15% |
| Appeared as having no degree | 6 | 9.84% |
| Attributed to another institution | 3 | 4.92% |
Source: Joseph Ugrin, “NASBA’s CPA exam reporting problems are improving, but not solved,” Accounting Today, May 26, 2026. The article is Ugrin’s first-person account of the joint UNI–NASBA reconciliation. Shares are Castleport Test Prep calculations from the reported counts.
Ugrin attributes the problem to education data captured when a candidate applies to sit and not updated after graduation. He also reports that NASBA said in a webcast that it would stop publishing institutional comparisons and restore custom reports.
We did not locate a published NASBA statement confirming that webcast decision. Treat it as a named participant’s report, not as a formal NASBA announcement. The UNI reconciliation is one institution; it does not establish an error rate for any other school.
How much does NASBA school-level CPA Exam data cost?
The newest official edition located for this review is the 2024 book, priced by NASBA at $300. NASBA’s published release notices also establish a $900 package price for the 2020–2023 editions; they do not support the draft’s $850 figure.
| Edition or package | Published price | What the official notice establishes |
|---|---|---|
| 2018 edition | $200 | Release price printed in NASBA’s October 2019 State Board Report |
| 2019 edition | $200 | Release price printed in NASBA’s Fall 2020 State Board Report |
| 2020 edition | $250 | Published price in the 2020–2023 release notice |
| 2021 edition | $250 | Published price in the 2020–2023 release notice |
| 2022 edition | $250 | Published price in the 2020–2023 release notice |
| 2023 edition | $300 | Published price in the 2020–2023 release notice |
| 2020–2023 four-book package | $900 | Published package price |
| 2024 edition | $300 | Price in NASBA’s August 2025 release |
Sources: NASBA’s October 2019 State Board Report, NASBA’s Fall 2020 State Board Report, the official 2020–2023 release notice carried in a state-board newsletter and NASBA’s 2024-edition release.
These are published release prices, not a claim that every edition remains in stock today. We did not calculate a supposed price for “every available year” because that number depends on a live catalogue, package overlap and current availability.
What does “CPA Exam pass rate by school” actually mean?
The phrase can describe several non-equivalent measures: sections, people, first attempts, all attempts, degree cohorts, or a graduation-linked subset. A school figure without the year, unit, attempt rule, cohort and denominator is not ready to quote.
| Measure | What it counts | Why the label matters |
|---|---|---|
| Sections passed ÷ sections attempted | Exam sections | A candidate who passes three of four sections contributes three passes and one nonpass, not one completed-exam failure. |
| Candidate completion | People who complete all required sections | One person is one unit; this is not interchangeable with a section pass rate. |
| First-time section attempts | A candidate’s first sitting for each section | It changes the population by excluding later attempts. |
| All section attempts | First attempts plus later attempts | It changes the population by including repeat sittings. |
| Degree cohort | Candidates grouped by the degree recorded in NASBA’s data | NASBA warns that candidates in graduate programs may still be recorded under a completed bachelor’s degree. |
| First-time within 365 days of graduation | First-time sections tied to a valid degree date and taken within one year | It is a tighter population than the main institution table. |
Source: Castleport Test Prep Research, “CPA Exam Pass Rates by School: What the Public Data Actually Says.” Verified August 5, 2026.
How far apart can two correct figures for one school be?
The University of Kansas published NASBA-derived 2023 figures of 81.4% for candidates recorded with a graduate degree and 69% for candidates recorded with only an undergraduate degree. That is a 12.4-point gap for one institution, one year and one source—created by the cohort definition.
Those are KU’s published figures from NASBA’s 2023 data, not an independent Castleport audit of the paid book. They show why “the school’s pass rate” is incomplete without the cohort.
Source: University of Kansas School of Business, March 5, 2025.
What are the current national CPA Exam pass rates?
The AICPA’s published national rates are the correct current benchmark for individual Exam sections, not a substitute for school data. For 2025, cumulative rates ranged from 41.94% on BAR to 77.65% on TCP; through Q2 2026, they ranged from 42.95% on FAR to 79.53% on TCP.
2025 full-year national section rates
| Section | Q1 | Q2 | Q3 | Q4 | Published cumulative |
|---|---|---|---|---|---|
| AUD | 44.30% | 49.05% | 50.03% | 48.78% | 48.21% |
| FAR | 41.67% | 43.52% | 43.07% | 40.20% | 42.12% |
| REG | 62.03% | 63.58% | 66.05% | 60.73% | 63.12% |
| BAR | 37.64% | 47.26% | 39.46% | 39.71% | 41.94% |
| ISC | 61.23% | 71.96% | 66.91% | 66.75% | 67.79% |
| TCP | 74.94% | 80.63% | 76.68% | 76.72% | 77.65% |
Source: Castleport Test Prep Research, “CPA Exam Pass Rates by School: What the Public Data Actually Says.” Verified August 5, 2026.
2026 national section rates through Q2
| Section | Q1 | Q2 | Published cumulative |
|---|---|---|---|
| AUD | 47.80% | 49.38% | 48.65% |
| FAR | 43.46% | 42.47% | 42.95% |
| REG | 66.65% | 66.87% | 66.78% |
| BAR | 41.30% | 45.62% | 43.64% |
| ISC | 66.79% | 67.98% | 67.45% |
| TCP | 79.28% | 79.75% | 79.53% |
Source: AICPA & CIMA, “Learn more about CPA Exam scoring and pass rates,” updated July 15, 2026.
A passing section score is 75 on a 0–99 scale. The AICPA says 75 is not a percentage of questions answered correctly and the Exam is not curved. Scores combine scaled multiple-choice and task-based-simulation performance.
Why can Discipline choice affect a school’s aggregate rate?
Under CPA Evolution, every candidate takes AUD, FAR and REG and chooses one Discipline: BAR, ISC or TCP. The published 2025 cumulative rates for those three Disciplines were 35.71 points apart (TCP at 77.65% versus BAR at 41.94%); through Q2 2026, they were 35.89 points apart (TCP at 79.53% versus BAR at 43.64%). Across all six sections, the widest Q2 2026 cumulative spread was 36.58 points because FAR was lower than BAR.
A school aggregate that combines all sections can therefore reflect its students’ Discipline mix as well as their results. A school with more TCP attempts and fewer BAR attempts is aggregating a different mix from a school with the reverse pattern. A fair current comparison needs section-level denominators or a stated method for controlling that mix.
Why should the published cumulative rate be used instead of averaging quarters?
A simple arithmetic mean of the four quarterly percentages does not always reproduce the AICPA’s published cumulative figure. The difference reached 1.08 points for ISC in 2025.
| Section | Simple mean of four 2025 quarters | AICPA published cumulative | Difference |
|---|---|---|---|
| AUD | 48.04% | 48.21% | 0.17 pts |
| FAR | 42.12% | 42.12% | 0.00 pts |
| REG | 63.10% | 63.12% | 0.02 pts |
| BAR | 41.02% | 41.94% | 0.92 pts |
| ISC | 66.71% | 67.79% | 1.08 pts |
| TCP | 77.24% | 77.65% | 0.41 pts |
Source: Castleport Test Prep calculation from the AICPA quarterly and cumulative figures above. Use the AICPA’s published cumulative figure rather than reconstructing one from unweighted quarterly percentages.
Why this page does not use a single 2015 national first-time benchmark
NASBA’s 2015 University Edition prints two conflicting first-time summaries. Its Section Description gives 70,228 candidates, 140,099 first-time attempts and a 52.3% pass rate; its later Overall Performance table gives 70,209 candidates, 140,101 attempts and a 55.0% pass rate.
Both figures appear in the same official PDF on printed pages 7 and 13. The difference is not a rounding issue. Because the source conflicts with itself, this page does not choose one and present it as the definitive 2015 national first-time benchmark.
Source: NASBA 2015 University Edition, printed pp. 7 and 13.
Where can school-level CPA Exam data still be found for free?
The strongest free sources answer narrower questions: Texas publishes historical university tools through December 2023, the Elijah Watt Sells announcements attach exceptional candidates to schools, and the CPA Success Index provides a discontinued 2023-based model. None is a current free national school pass-rate dataset.
Texas State Board of Public Accountancy
Texas provides three official tools covering June 2004 through December 2023:
- candidate counts by university;
- section counts by university; and
- a university comparison with sections tested, sections passed and percentage passed.
The source is Texas-only and ends with the pre-Evolution Exam. It remains useful because the candidate and section counts are visible.
Source: Texas State Board of Public Accountancy, Exam Performance.
Elijah Watt Sells Award announcements
The AICPA and NASBA name each recipient’s education in annual award announcements. That makes the releases school-linked, but the group is far too small to serve as a school comparison.
| Testing year | Award recipients | People who sat for the Exam | Approximate frequency |
|---|---|---|---|
| 2024 | 11 | More than 74,000 | About 1 in 6,700 |
| 2025 | 6 | More than 87,000 | Fewer than 1 in 14,500 |
Sources: 2024 award announcement and 2025 award announcement. Castleport Test Prep calculated the approximate frequencies.
Six people is a distinction. It is not a school dataset.
CPA Success Index
Charles Davis, Timothy Lindquist and Joseph Ugrin created the CPA Success Index in 2020 to estimate the likelihood of completing all four sections within the credit window from first-time section results. The final pre-Evolution edition used NASBA’s 2023 data and reported an average across 529 universities with more than 20 candidates.
The authors did not continue the calculation with the 2024 book because of their concerns about the new university data. The index remains a historical methodology, not a current school pass-rate source.
Source: Accounting Today, CPA Success Index methodology and 2023 data, January 23, 2025.
How should a school’s CPA pass-rate claim be evaluated?
Five questions expose most ambiguity immediately: year, unit, attempt rule, cohort and denominator. A sixth—comparison against the matching national measure—shows whether the number has any context.
- What year does the result cover? Use the data year, not merely the publication date.
- What is the unit? Sections passed, candidates completing, or something else.
- Which attempts count? First attempts only, all attempts, or a graduation-linked subset.
- Which cohort is included? Undergraduate, graduate, combined, or the degree recorded when the candidate applied.
- What is the denominator? Candidate count and section-attempt count should both be visible when available.
- What is the matching benchmark? Compare the same year, section or aggregate method, cohort and attempt rule.
A claim that answers all six can be interpreted. A bare percentage cannot.
Methodology
This page combines direct transcription, source-text verification and reproducible arithmetic. Every one of the 101 data rows was checked against text extracted from the four official NASBA source documents; all numeric fields matched, and source spellings are retained separately from editorially normalized school names in the downloadable CSV.
Dataset scope. We included exactly four public tables: 2015 positions 1–40, 2016 positions 1–40, 2018 positions 1–10, and 2019 through position 10 including ties. That produces 101 rows. We do not describe it as NASBA’s complete historical public record; an official 2010 publication, for example, also contains an institution table.
Fields preserved. Official source position, institution as printed, normalized institution name, state and FICE code where printed, first-time candidates, first-time section attempts, pass rate and average score where printed.
Field added. One-result sensitivity, calculated as:
text one-result sensitivity = 100 ÷ first-time section attempts
Original summaries. We calculated the 41-entry top-ten aggregation, candidate-count median, position-band table, 50-candidate demonstration, Penn–UT Austin denominator comparison, UNI shares, Discipline spreads and quarterly-mean comparison. Whole-number shares are rounded to the nearest whole percent for the opening quote; table means use conventional half-up rounding to two decimals.
Source anomalies. We preserved source spellings in the CSV, including “UNIV MO COLLUMBIA” in the 2015 table and “University of North Carolina at Ashevill” in the 2018 excerpt, while using normalized names in the visible article. We also disclose the conflicting 2015 national first-time summaries instead of silently selecting one.
Current paid material. We did not reproduce university rows from NASBA’s paid 2020–2024 books. Later-edition statements on this page are limited to what NASBA disclosed publicly and the named UNI reconciliation described above.
Verification date. All linked source pages, tables, calculations and current AICPA rates were rechecked on August 5, 2026. Dataset version: 1.0.
Limitations
This page makes the denominators visible; it does not turn historical excerpts into a current measure of school quality. The four selected tables are useful because they expose candidate and attempt counts, but their scope and age impose hard limits.
- The 101 rows are a defined dataset, not every public NASBA institution table ever released. They cover four selected years and table scopes.
- The public school tables are excerpts. In 2019, the paid book covered 1,117 schools at the section level; the public table printed 11 rows.
- All four school tables predate CPA Evolution. They do not describe performance on the current Core-plus-Discipline Exam.
- One-result sensitivity is descriptive. It does not correct a rate, estimate uncertainty or measure quality.
- The 50-candidate line is ours. Another threshold changes the result.
- The UNI case is one institution. It documents a real reconciliation but does not establish the error rate elsewhere.
- The webcast policy report is not an official published NASBA statement. We label it accordingly.
- Current national section rates are not directly interchangeable with historical first-time school aggregates. The section structure and reporting populations differ.
- Published prices are release prices. They are not a live inventory audit.
- Exam outcomes do not isolate teaching quality. Candidate selection, timing, recorded degree, attempt mix, Discipline choice and denominator size all matter.
How to cite this page
Castleport Test Prep. “CPA Exam Pass Rates by School: What the Public Data Actually Says.” Castleport Test Prep Research. Published and verified August 5, 2026. https://castleporttestprep.com/research/cpa-exam-pass-rates-by-school/
For the dataset:
Castleport Test Prep. “Verified NASBA School-Level CPA Exam Pass-Rate Tables, 2015–2019, with One-Result Sensitivity.” Version 1.0, August 5, 2026. https://castleporttestprep.com/research/data/cpa-exam-pass-rates-by-school-2015-2019.csv
For a school figure supplied by NASBA, cite the underlying NASBA publication as well. Each table above names the source document and page.
Frequently asked questions
Which school has the highest CPA Exam pass rate?
There is no verified current free national answer. In the latest free NASBA school pass-rate table reviewed here, covering 2019, the University of Pennsylvania placed first at 90.9% on 11 first-time candidates and 22 section attempts; UT Austin was at 89.5% on 358 candidates and 980 attempts.
Does NASBA publish CPA pass rates by school for free?
NASBA publishes current paid university analyses, but the latest free official national table reviewed here that prints school pass rates covers 2019. The 2024 paid edition costs $300, while its public announcement names candidate-volume leaders rather than printing current school pass rates.
How much does the NASBA Candidate Performance report cost?
NASBA priced the 2024 edition at $300. The published package price for the 2020, 2021, 2022 and 2023 editions was $900; the 2020–2022 books were listed at $250 each and the 2023 book at $300.
What is the average CPA Exam pass rate?
There is no single current rate because the six sections differ. For 2025, the AICPA’s cumulative rates were AUD 48.21%, FAR 42.12%, REG 63.12%, BAR 41.94%, ISC 67.79% and TCP 77.65%; through Q2 2026 they were 48.65%, 42.95%, 66.78%, 43.64%, 67.45% and 79.53%, respectively.
Is a CPA Exam score of 75 equal to 75% correct?
No. The AICPA reports scores on a 0–99 scale, says 75 is the minimum passing score, and states that the reported score is not a percentage correct. The Exam is not curved.
Can I find my university’s CPA pass rate anywhere?
For a Texas institution, the Texas State Board of Public Accountancy provides free university tools from June 2004 through December 2023. Elsewhere, ask the accounting department for the exact year, unit, attempt rule, cohort, candidate count and section count; a percentage without those labels is incomplete.
Are CPA Exam pass rates comparable between schools?
Less than they appear. Candidate pools differ sharply, degree records can lag a candidate’s actual program, first-time and all-attempt figures use different populations, and the current Exam’s Discipline rates differ by more than 35 points nationally.
What is one-result sensitivity?
It is 100 divided by a school’s first-time section attempts. The result shows how many percentage points the reported pass rate would move if one section result changed while the denominator stayed fixed; it is not a margin of error or an adjusted rate.
Related Castleport Test Prep research
Sources
- NASBA — Candidate Performance on the Uniform CPA Examination, 2015 University Edition
- NASBA — Candidate Performance on the Uniform CPA Examination, 2016 University Edition
- NASBA — October 2019 State Board Report, 2018 school table
- NASBA — Fall 2020 State Board Report, 2019 school table
- NASBA — 2021 publication-pause notice
- NASBA — 2020–2023 editions release, November 2024
- Official state-board newsletter — published 2020–2023 edition prices
- NASBA — 2024 edition release and $300 price
- AICPA & CIMA — CPA Exam scoring and 2025–2026 pass rates
- AACSB International and American Accounting Association — January 2022 letter to NASBA
- Joseph Ugrin — UNI/NASBA candidate reconciliation, May 26, 2026
- Texas State Board of Public Accountancy — Exam Performance
- University of Kansas — published 2023 graduate and undergraduate figures
- AICPA and NASBA — 2024 Elijah Watt Sells Award announcement
- AICPA and NASBA — 2025 Elijah Watt Sells Award announcement
- Accounting Today — CPA Success Index methodology and 2023 data
- NASBA — Candidate Performance on the Uniform CPA Examination, 2010 Edition
Castleport Test Prep is an independent exam-preparation publisher. The /research section is an independent research and reference resource, published free.