Castleport Test Prep Editorial Team Last verified: August 4, 2026
Castleport Test Prep is an independent publisher. It is not affiliated with NCSBN, Pearson VUE, any state nursing board, CCNE, ACEN, or any nursing school.
A nursing school's NCLEX pass rate is close to meaningless without one other number: how many people it tested.
In Michigan's official 2025 NCLEX report, 11 named nursing-program records posted a 100% first-time pass rate. Eight of the 11 had fewer than 25 first-time candidates, and cohort sizes ranged from 8 to 86. Their 95% Wilson lower bounds ranged from 67.6% to 95.7%.
Identical observed pass rate. A 28.2-point difference in the interval lower bound.
That gap is the whole problem with NCLEX pass rates by nursing school. NCSBN develops the NCLEX and publishes national and jurisdiction-level statistics, but it does not publish an official public school-name table. Its help center says NCSBN does not share pass rates for specific programs or candidates and that individual nursing regulatory bodies decide whether and how to release additional program data.
So every school-level number you see comes from a regulator, a program's own disclosure, or an aggregation of those separate sources. This page documents where the number came from, what it measured, how many candidates sat behind it, and how much weight the percentage can hold.
| Measure | Verified result |
|---|---|
| Michigan named program records reporting 100% first-time in 2025 | 11 |
| Those records with fewer than 25 first-time candidates | 8 of 11 |
| Smallest and largest perfect-rate cohorts | 8 and 86 |
| 95% Wilson lower-bound range for those cohorts | 67.6%–95.7% |
| 2025 first-time U.S.-educated NCLEX-RN rate | 86.7% — 167,272 of 192,916 |
| 2025 first-time U.S.-educated NCLEX-PN rate | 86.6% — 47,470 of 54,818 |
Source: Michigan LARA's official 2025 NCLEX program report, NCSBN's final 2025 examination statistics, and Castleport calculations described below.
Table of contents
- What does a 100% NCLEX pass rate mean when the cohort is small?
- NCLEX pass-rate statistics: the 2025 national benchmark
- What this shows and what it does not
- How we built this
- Does NCSBN publish NCLEX pass rates by nursing school?
- Where to find pass-rate data for a specific nursing school
- How to compare NCLEX pass rates by nursing school
- What is a good NCLEX pass rate for a nursing school?
- Why a school's advertised rate can differ from the board's
- What happens when a nursing program falls below the standard?
- Why 2025 and 2026 results need clear labels
- Limitations
- Frequently asked questions
- Sources
- How to cite this page
What does a 100% NCLEX pass rate mean when the cohort is small?
It means every candidate in that reported cohort passed. It does not mean every 100% result carries the same precision. Michigan's 11 perfect first-time program records ranged from 8 candidates to 86, and 8 of the 11 had fewer than 25 candidates.
We normalized Michigan's official 2025 report into 111 report records: 105 named program records, 4 special records, and 2 statewide summaries. One hundred named program records contained a nonzero first-time cohort. Eleven reported a first-time rate of 100%.
| Program | Exam | Program code | Passed/tested | Observed rate | One candidate equals | 95% Wilson lower bound |
|---|---|---|---|---|---|---|
| Northwestern Michigan College | PN | US09109500 | 8/8 | 100.0% | 12.5 points | 67.6% |
| Kalamazoo Valley Community College | PN | US09106600 | 9/9 | 100.0% | 11.1 points | 70.1% |
| Gogebic Community College — Houghton | PN | US09109800 | 10/10 | 100.0% | 10.0 points | 72.2% |
| Jackson Community College — PN | PN | US09109200 | 11/11 | 100.0% | 9.1 points | 74.1% |
| Gogebic Community College — Ironwood | PN | US09106900 | 12/12 | 100.0% | 8.3 points | 75.8% |
| Monroe County Community College | PN | US09103500 | 15/15 | 100.0% | 6.7 points | 79.6% |
| Wayne County Community College District — Belleville | PN | US09110500 | 23/23 | 100.0% | 4.3 points | 85.7% |
| University of Detroit Mercy — Grand Rapids | RN | US09511300 | 24/24 | 100.0% | 4.2 points | 86.2% |
| Bay de Noc Community College — ADN | RN | US09408400 | 26/26 | 100.0% | 3.8 points | 87.1% |
| Muskegon County Community College | PN | US09108900 | 43/43 | 100.0% | 2.3 points | 91.8% |
| Grand Rapids Community College — ADN | RN | US09400700 | 86/86 | 100.0% | 1.2 points | 95.7% |
Source: Michigan LARA, 2025 NCLEX Program Summaries. Candidate counts and reported percentages are from the official report. Program-record count, cohort-size summary, one-candidate sensitivity, and Wilson intervals are Castleport calculations. Download the normalized data.
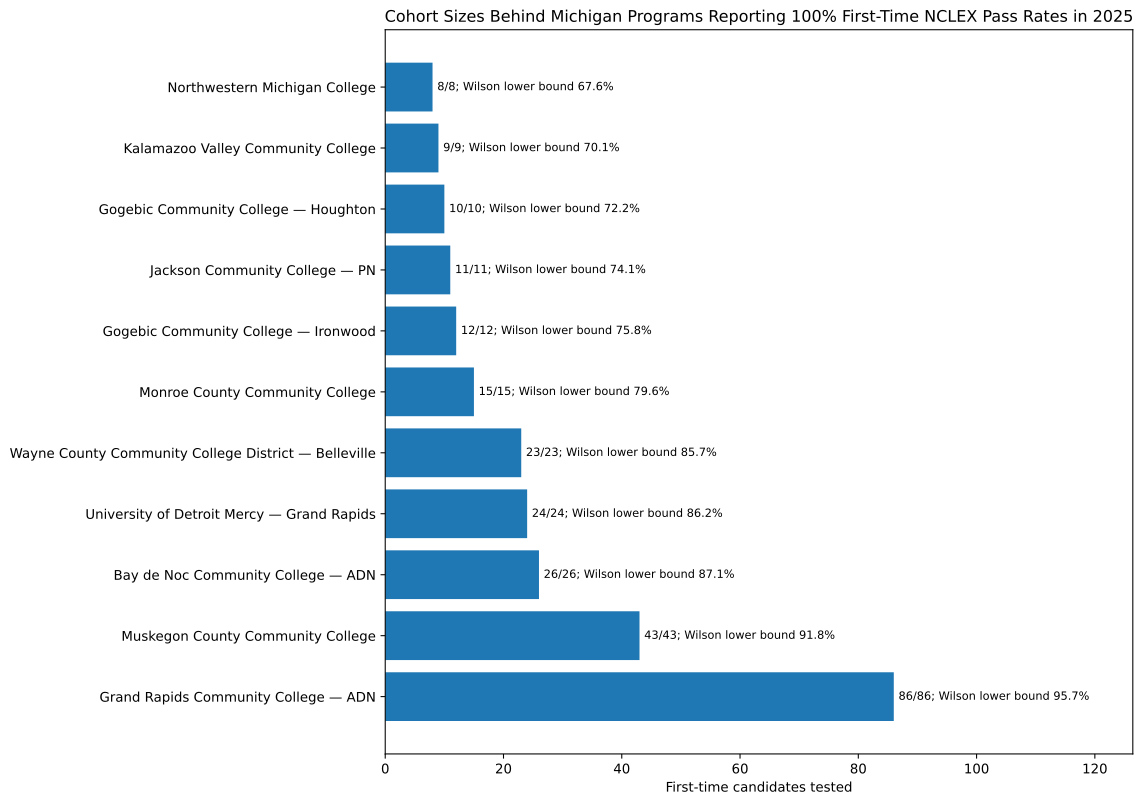
The Wilson interval does not change what happened in those cohorts. Northwestern Michigan College reported 8 first-time candidates and 8 passes. Grand Rapids Community College's ADN program reported 86 and 86. Nobody in either reported cohort failed.
The interval answers a narrower question: how precise is it to use that one observed cohort as evidence about a broader, repeatable pass probability under a binomial model? At the boundary where every candidate passed, the 95% Wilson lower bound reduces to:
n ÷ (n + 1.96²)
That gives 67.6% for 8 of 8 and 95.7% for 86 of 86.
The other exact measure in Table 1 is even simpler:
one-candidate sensitivity = 100 ÷ candidates tested
One candidate represents 12.5 percentage points in an eight-person cohort and about 1.2 points in an 86-person cohort.
To be clear about what belongs to whom: Michigan publishes the counts and observed rates. Castleport calculated the count of 11 perfect-rate named program records, the eight-under-25 result, the one-candidate sensitivity, and every Wilson interval. Michigan does not publish those derived measures or characterize the programs this way.
We are not picking on Michigan. Michigan is the example because its public report gives the numerator and denominator for each record. That is what makes the analysis possible.
The practical takeaway: a pass-rate percentage without the candidate count is an incomplete data point.
NCLEX pass-rate statistics: the 2025 national benchmark
In 2025, 167,272 of 192,916 first-time U.S.-educated candidates passed the NCLEX-RN, a rate of 86.7%. On the NCLEX-PN, 47,470 of 54,818 passed, a rate of 86.6%. These are national candidate-group results, not school-level pass rates.
| Candidate group | Tested | Passed | Pass rate |
|---|---|---|---|
| NCLEX-RN, first-time, U.S.-educated | 192,916 | 167,272 | 86.7% |
| NCLEX-RN, repeat, U.S.-educated | 42,513 | 22,404 | 52.7% |
| NCLEX-RN, first-time, internationally educated | 52,827 | 24,999 | 47.3% |
| NCLEX-RN, all candidates | 328,443 | 226,946 | 69.1% |
| NCLEX-PN, first-time, U.S.-educated | 54,818 | 47,470 | 86.6% |
| NCLEX-PN, all candidates | 68,996 | 53,362 | 77.3% |
Source: NCSBN, 2025 NCLEX Examination Statistics. Verified August 4, 2026.
Two things to hold onto.
First, 69.1% answers a different question from 86.7%. The 69.1% row includes every NCLEX-RN candidate category in NCSBN's U.S.-licensure table. The 86.7% row is first-time, U.S.-educated candidates. When the subject is a U.S. nursing program's first-time graduates, 86.7% is the closer national comparison—but only when the school source uses a compatible definition.
Second, RN and PN do not mix. They are different examinations for different licensure levels. A program offering both has separate results, and a combined RN/PN percentage does not answer either exam-specific question.
The first-time U.S.-educated NCLEX-RN rate fell from 91.2% in 2024 to 86.7% in 2025, a decline of 4.5 percentage points. The change is real; its cause is not established by these aggregate statistics alone.
What this shows and what it does not
This page shows where school-level NCLEX data comes from, what each source measures, and how much context sits behind a percentage. It does not tell you which nursing school to attend.
What it shows:
- The latest complete national candidate-group benchmarks.
- A reproducible, row-level Michigan 2025 analysis.
- Which official source publishes program data in each U.S. jurisdiction.
- Why candidate counts change the interpretation of the same observed percentage.
- Why state rules and accreditation calculations cannot be reduced to one universal cutoff.
- Why two accurate pass-rate claims can disagree because they measure different groups or periods.
What it does not show:
- Whether any named program is currently compliant with a state rule.
- Admission selectivity, attrition, completion, tuition, clinical-placement quality, employment, or student support.
- That a Wilson interval is a school-quality measure.
- That a high observed pass rate caused by a program's instruction will repeat.
- A complete national row-level database of every nursing program. The downloadable school-level file is Michigan-only; the national file is a source directory.
How we built this
Everything on this page traces to a source you can open, a calculation you can reproduce, or a limitation stated beside the claim.
Source hierarchy
- Official NCSBN examination statistics for national candidate-group results.
- Official state nursing-board, regulator, statute, rule, meeting record, or program report for state and school-level claims.
- Current accreditor standards for accreditation calculations.
- Peer-reviewed original research for findings about reporting practices and measurement reliability.
- A school disclosure only when clearly labeled as school-reported; no school-reported figure is used in the original Michigan analysis.
National figures
The national counts and rates come from NCSBN's final 2025 examination-statistics publication. The 2024 comparison comes from NCSBN's final 2024 publication. RN and PN remain separate, and candidate categories are not relabeled.
Michigan program data
The Michigan source covers January 1 through December 31, 2025 and was generated January 2, 2026. We normalized 111 report records:
- 105 named program records,
- 4 special records,
- 2 statewide summaries.
We preserved exam type, program code, first-time counts, repeater counts, total counts, reported rates, source-page location, source URL, and verification date. No missing numerator or denominator was invented. Wilson intervals were calculated only where the required counts existed.
Original calculations
For a perfect observed cohort where x = n, the 95% Wilson lower bound is:
n ÷ (n + z²), with z = 1.96.
One-candidate sensitivity is:
100 ÷ candidates tested.
The source rows, formulas, and derived fields are available in the downloads.
Public-access update
A peer-reviewed 2025 study initially found program-level NCLEX reporting in 47 states plus the District of Columbia. Alaska, Michigan, and Vermont were the three exceptions at the beginning of the study; Michigan posted program results while the study was underway.
We re-checked those three exceptions only:
- Michigan now publishes detailed program reports.
- Alaska's December 2025 Board of Nursing minutes contain a six-program, five-year pass-rate table.
- No centralized Vermont Board of Nursing program table was located.
That produces the 50-of-51, or 98.0%, public-access figure under this targeted update method. It is not a new full audit of all 51 jurisdictions.
State standards
Each rule in the comparison section was read in the issuing state's current rule, statute, or regulator publication. The common-input arithmetic is labeled as an illustration; it is not represented as a board's official compliance determination.
Downloads
- Michigan 2025 normalized program outcomes, with Wilson intervals and one-candidate sensitivity (CSV)
- Michigan programs reporting 100% first-time in 2025 (CSV)
- Official school-level source directory for all 51 U.S. jurisdictions (CSV)
Castleport's site-wide methodology, editorial standards, and corrections policy describe the broader publication process.
What we did not do
We did not create a proprietary school score. We did not combine RN and PN. We did not force incompatible reporting periods into one national school average. We did not silently convert missing counts into estimates. We link to the state-hosted Michigan report rather than republishing the original PDF.
Does NCSBN publish NCLEX pass rates by nursing school?
No official public NCSBN school-name table covers every nursing program. NCSBN's public statistics break results down by candidate type, program type, jurisdiction, attempt status, and education location—not by individual school.
NCSBN's help center says it does not share pass rates for specific programs or candidates. It also says nursing regulatory bodies choose whether and how to release additional pass-rate information for their approved programs.
Program-level reporting exists inside the system. NCSBN makes NCLEX Program Reports available to approved programs for a fee through Mountain Measurement. That is a program service, not a public national school lookup.
This corrects a common overstatement: individual boards are not publishing under one uniform national reporting mandate established by NCSBN. The public result is decentralized, which is why the files use different formats, years, definitions, and levels of detail.
Primary source: NCSBN, “How do I find the NCLEX pass rates for a nursing school?”.
Where to find pass-rate data for a specific nursing school
Start with the nursing regulatory body in the jurisdiction where the program is located. Match the exact campus, program code or degree path, exam, reporting period, and number tested before using the percentage.
The 2025 peer-reviewed reporting study and our targeted update put school-level public availability at 50 of 51 jurisdictions, with the qualification stated in the methodology above.
| Jurisdiction | Official source | Latest complete period observed | What the source exposes | Definition or comparability note |
|---|---|---|---|---|
| Alaska | Board of Nursing minutes | 2024 in a 2020–2024 table | Six program rows; no candidate denominator in the displayed table | Public but buried in meeting minutes; first-time definition not stated in the table |
| California, RN | Board of Registered Nursing | 2024/2025 | Program rates with candidate counts | July 1–June 30; first-time California-educated graduates/completers, including those who did not test immediately |
| Florida | Board of Nursing program reports | 2025 | Program-level first-time counts and rates in linked reports | Calendar-year source; current statute uses comparable degree-program national averages |
| Michigan | LARA 2025 program report | 2025 | First-time, repeater, and total counts and rates | Calendar year; program code and exam shown |
| New York | State Education Department | 2025 | Annual rate plus passed/total by program | First-time test-takers |
| North Carolina | Board of Nursing | 2025 annual; 2026 quarterly also posted | Program rates and candidate counts | First writing; annual compliance year ends December 31 |
| Ohio | Board of Nursing reports | 2025 | Official report files; detail varies by file | Compliance rule refers to first-time candidates testing within six months of completion |
| Washington | State Board of Nursing | 2025 | First-time program counts and rates | Annual source |
| Vermont | Board of Nursing | No centralized table located | — | This is a documented source-location result, not proof that no program data exists anywhere |
Source: Castleport's direct review of the linked official sources, verified August 4, 2026. Download the complete 51-jurisdiction source directory.
Look at what that table does to a school comparison. California's RN table uses a July-to-June period. Michigan uses a calendar year. Alaska's table gives no denominator. Florida's compliance comparator is degree-specific. Those are not cosmetic differences.
How to compare NCLEX pass rates by nursing school
Confirm that the exam, program, period, candidate definition, and denominator match before comparing two school percentages. When one of those fields changes, the meaning of the number changes with it.
Use this sequence.
- Which exam? NCLEX-RN or NCLEX-PN. Keep them separate.
- Which program and campus? One institution can have several campuses, degree paths, and program codes.
- Which reporting period? Calendar year, academic year, quarter, rolling period, or three-year mean.
- Who is counted? First-time candidates, repeaters, all takers, U.S.-educated candidates, or a state-defined subset.
- How many tested and passed? Prefer
passed/testedover a percentage standing alone. - Is the period complete? Do not compare a partial 2026 quarter with a complete 2025 year.
- Is there a comparable multi-year pattern? Use it when the source definition stays the same.
- Was the source corrected or replaced? Keep the report date and verification date.
- What is missing? NCLEX results do not reveal students who entered but never graduated or never reached the exam.
| Candidates tested | One candidate represents |
|---|---|
| 8 | 12.5 percentage points |
| 10 | 10.0 points |
| 15 | 6.7 points |
| 25 | 4.0 points |
| 50 | 2.0 points |
| 86 | 1.2 points |
| 100 | 1.0 point |
| 200 | 0.5 point |
Source: Castleport calculation, 100 ÷ candidates tested.
First-time results are useful for studying initial preparation. All-attempt results answer a different question. Neither label should be substituted for the other, and an all-attempt percentage is not guaranteed to be higher in every dataset.
What is a good NCLEX pass rate for a nursing school?
The 2025 national first-time rates—86.7% for NCLEX-RN and 86.6% for NCLEX-PN—are useful descriptive benchmarks. They are not universal regulatory cutoffs. State rules use different formulas, candidate groups, and time periods.
Page after page reduces this to “80%.” That is too simple.
| Jurisdiction | Rule structure | What the current source says | Primary source |
|---|---|---|---|
| Ohio | Percentage of national average | A program below 95% of the national average for first-time candidates testing within six months of completion enters an escalating action sequence | Ohio Admin. Code 4723-5-23 |
| North Carolina | Percentage of national pass rate | A program must meet or exceed 90% of the national pass rate for its licensure level, on first writing, for the calendar year ending December 31 | North Carolina Board of Nursing |
| Florida | Points below a degree-specific national average | A program may not be more than 10 percentage points below the national average for U.S.-educated, first-time graduates of comparable degree programs; two consecutive years below can lead to probationary status | Fla. Stat. § 464.019 |
| Georgia, professional nursing | Fixed percentage with two periods | At least 80% of first-time writers in any graduation cohort and at least 80% over the four most recent years | Ga. Comp. R. & Regs. R. 410-8-.09 |
| Washington | Fixed annual percentage with escalation | An average annual pass rate of 80% for first-time test takers; the response escalates across repeated years below the standard | WAC 246-840-558 |
| Louisiana, pre-RN programs | Fixed annual percentage with warning/probation sequence | An 80% first-time calendar-year standard; a warning after one year below, and probation after two consecutive years or two of the last three | Louisiana Register, December 2024 final rule |
Source: The issuing state rule, statute, or regulator publication in the final column. Verified August 4, 2026.
The formulas can still be compared—but only if the comparison is labeled honestly.
| Rule mechanic | Illustrative calculation | Result |
|---|---|---|
| 95% of a national rate | 0.95 × 86.7 | 82.4% |
| Fixed floor | — | 80.0% |
| 90% of a national rate | 0.90 × 86.7 | 78.0% |
| 10 percentage points below a national rate | 86.7 − 10 | 76.7% |
Source: Castleport arithmetic using the same 86.7% input solely to show how the formulas behave.
Forced to one common input, those formulas span 76.7% to 82.4%—a 5.7-point spread.
That is not an official 2025 state-compliance table. Ohio's rule refers to a six-month candidate population. Florida uses the national average for comparable degree programs. A board's operative number can therefore differ from the illustration.
The honest conclusion is narrower: “good” and “compliant” are not synonyms, and neither has one national percentage.
Relative standards also move when their underlying comparator moves. The rule can stay unchanged while the arithmetic threshold changes from one year to the next.
Why a school's advertised rate can differ from the board's
The two numbers may both be accurate and still measure different groups. Current national accreditation standards allow more than one licensure-pass-rate calculation, while state boards publish according to their own rules and reporting systems.
CCNE's Amended 2026 standards let a pre-licensure program demonstrate the 80% licensure outcome in one of four ways.
| Option | Candidate group | Period |
|---|---|---|
| 1 | First-time takers | Most recent calendar year |
| 2 | All takers—first-time takers and repeaters who pass | Most recent calendar year |
| 3 | All first-time takers | Three most recent calendar years |
| 4 | All takers—first-time takers and repeaters who pass | Three most recent calendar years |
CCNE requires the rate for each campus/site and track regardless of the number of test takers, requires the program to identify the option used, and permits exclusion of candidates who test more than two years after program completion.
ACEN's current Criterion 5.3 also permits the most recent annual pass rate or the mean of the three most recent years to meet at least one of three routes:
- 80% or greater for first-time test-takers;
- 80% or greater for first-time test-takers and repeaters; or
- at or above the national or territorial mean for the program type.
Source: ACEN Standard 5, Criterion 5.3.
So when a school says it “meets the 80% standard,” that statement does not, by itself, tell you whether the number is a single-year first-time rate, a three-year mean, or a calculation including repeaters.
That is not an accusation. Those are permitted standards. It is a reason to ask what the numerator, denominator, candidate definition, and period actually are.
What happens when a nursing program falls below the standard?
There is no automatic national sequence. State responses can include an assessment, improvement plan, warning, conditional or probationary status, site visit, admissions restriction, or withdrawal of approval. The issuing board's current rule and order control the result.
Examples from the verified sources:
- Ohio uses an escalating sequence tied to one year and consecutive years below its relative standard.
- Florida can place a program on probationary status after two consecutive calendar years below its statutory passage-rate requirement.
- Georgia requires an assessment and plan of action after a year below the applicable requirement; a second consecutive year can bring a site visit, and continued noncompliance can affect approval.
- Washington requires an assessment after one year below 80%, a correction plan after two consecutive years, conditional status after three, and a full evaluation with possible withdrawal after four of five years.
- Louisiana sends a warning after one year below 80% and places a pre-RN program on probation after two consecutive years or two of the last three.
The effect on current students is case-specific. A board action may address new admissions, teach-out, approval status, or graduate eligibility. Do not infer the effect from the percentage alone; read the current board order.
Published research shows why this gets complicated. A 2017 study of 1,792 nursing programs found that almost 20% violated their state standard at least once from 2010 through 2014. Among programs classified below the standard, 28.4% had a 95% confidence interval extending above it. Among programs classified at or above the standard, 17.4% had an interval extending below it.
That does not prove any particular board decision was wrong. It shows that a hard percentage line can classify small and unstable cohorts with substantial uncertainty.
A 2019 follow-up using 2,157 programs in 45 states from 2010 through 2016 found substantial variation in state standards and that program pass rates were not stable over time.
Sources: Foreman, 2017 and Foreman, 2019.
Why 2025 and 2026 results need clear labels
The data year and the exam-plan year are not the same thing. The complete national and Michigan outcomes on this page are from 2025. New RN and PN test plans took effect April 1, 2026.
The Next Generation NCLEX launched April 1, 2023. NCSBN's 2026 RN and PN test plans are effective from April 1, 2026 through March 31, 2029.
That gives the page three dates that should never be blurred:
- 2025: the complete outcome year used in the national and Michigan tables;
- January 2, 2026: the date Michigan's 2025 report was generated;
- April 1, 2026: the effective date of the current RN and PN test plans.
A school can publish a “2026” page that contains 2025 outcomes, a partial 2026 quarter, or outcomes under two different test-plan periods. The label should tell you which one.
The national first-time U.S.-educated RN rate changed from 91.2% in 2024 to 86.7% in 2025. Aggregate statistics establish the change; they do not establish one cause.
Sources: NCSBN 2024 Examination Statistics, NCSBN 2025 Examination Statistics, Next Generation NCLEX, and current NCLEX test plans.
Limitations
We would rather you know these than find them yourself.
The Michigan analysis is one jurisdiction and one year. It demonstrates denominator sensitivity and a reproducible interval calculation. It is not a complete national school-level dataset.
A Wilson interval is model-based. The reported 2025 cohort is the full observed cohort in the source, not a random survey sample. The interval is useful only when the cohort is treated as evidence about a broader underlying or future pass probability under binomial assumptions. It does not alter the observed result.
The interval is not a quality score. A wide interval means the cohort supplies less precision. It does not mean the school is poor. A narrow interval does not prove the school is good.
The 50-of-51 figure is a targeted update. The 2025 peer-reviewed study supplies the original 51-jurisdiction review. Castleport re-checked only Alaska, Michigan, and Vermont, the study's original exceptions.
The national source directory is not a normalized national school table. Some official sources publish counts, some publish percentages only, and some bury the result in minutes or linked files.
The state-rule table is a verified subset. It demonstrates different rule structures; it does not summarize every approval rule in every jurisdiction.
The common-input table is illustrative arithmetic. It does not replace a state's exact comparator population or official calculation.
Rules as written are not every enforcement decision. Boards can consider other facts and issue program-specific orders.
Pass rates omit students who never reached the exam. Admission, attrition, graduation, completion, time to completion, cost, and employment need separate evidence.
Source files can be revised. The verification date and report date matter.
This is educational research, not legal, accreditation, licensure, or compliance advice. Check the current regulator and accreditor source for a live program decision.
Frequently asked questions
Is there a national list of NCLEX pass rates by nursing school?
NCSBN does not publish an official public school-name table covering every nursing program. It publishes national and jurisdiction-level statistics, while individual nursing regulatory bodies decide whether and how to release school-level results. Third-party national compilations are aggregations of those separate sources.
How do I find the NCLEX pass rate for a specific nursing school?
Start with the nursing regulatory body in the state or jurisdiction where the program is located. Use the source directory on this page to find the official education or pass-rate page, then match the program name, campus, exam, reporting period, and candidate count.
What is a good NCLEX pass rate for a nursing school?
The 2025 first-time U.S.-educated national rates—86.7% for NCLEX-RN and 86.6% for NCLEX-PN—are useful descriptive benchmarks. They are not universal regulatory minimums. State rules and accreditation standards use different candidate groups, time periods, and formulas.
Do all states publish NCLEX pass rates by nursing school?
A 2025 peer-reviewed study initially found program-level reporting in 47 states plus the District of Columbia. A targeted update of the study's three original exceptions found public program-level data for Michigan and Alaska, while no centralized Vermont table was located. Under that limited method, school-level results were publicly findable in 50 of 51 jurisdictions.
Why does a school’s website show a different pass rate than the state board?
The two numbers may use different candidate groups or periods. One may be first-time candidates, another may include repeaters; one may cover a single year, another three years; and accreditation standards may permit calculations that differ from a board's published annual table.
Is a 100% NCLEX pass rate impressive?
It is an exact description of the reported cohort, but its precision depends on the denominator. In Michigan's 2025 data, 8 of 8 and 86 of 86 both equal 100%, while their 95% Wilson lower bounds are 67.6% and 95.7%. The interval is not a school-quality score.
What happens when a nursing program falls below its pass-rate standard?
The result depends on the jurisdiction. Possible responses include an assessment, improvement plan, warning, conditional or probationary status, site visit, admissions restriction, or withdrawal of approval. A board's current order—not a national rule—determines the effect on a particular program.
Should I compare NCLEX-RN and NCLEX-PN pass rates?
No. They are separate examinations for different licensure levels and should be analyzed separately. Compare the same exam, candidate definition, reporting period, and program type.
Does a nursing-school NCLEX pass rate include students who dropped out?
Usually not. The denominator normally contains candidates who reached and took the examination under the source's definition. Admission, attrition, graduation, and completion rates require separate data.
How often is this page updated?
National figures are re-verified when NCSBN publishes final annual statistics. State-source links are checked on a continuing schedule, rule citations are re-read at least annually, and derived statistics are recalculated whenever the underlying rows change. The visible date moves only after re-verification.
Sources
Exam administrator and national statistics
- NCSBN, 2025 NCLEX Examination Statistics
- NCSBN, 2024 NCLEX Examination Statistics
- NCSBN, NCLEX pass-rate dashboard
- NCSBN Help Center, “How do I find the NCLEX pass rates for a nursing school?”
- Next Generation NCLEX
- Current NCLEX test plans
Original school-level source
Accreditors
- Commission on Collegiate Nursing Education, Standards for Accreditation, Amended 2026
- Accreditation Commission for Education in Nursing, Standard 5: Outcomes
State sources used in the rule and access tables
- Alaska Board of Nursing, December 19, 2025 meeting minutes
- California Board of Registered Nursing, program pass rates
- Florida Board of Nursing, education-program reports
- Florida Statutes § 464.019
- Georgia Board of Nursing rules, current 2026 compilation
- Louisiana Register, December 2024 final rule
- New York State Education Department, RN NCLEX results
- North Carolina Board of Nursing, NCLEX pass rates
- Ohio Administrative Code 4723-5-23
- Washington Administrative Code, Chapter 246-840
- Washington State Board of Nursing, 2025 program pass rates
- Vermont Board of Nursing
Peer-reviewed research
- Eisenhauer, 2025, “A Cross-Sectional Analysis of Reporting NCLEX Pass Rates by Nursing Program in the United States”
- Foreman, 2017, “The accuracy of state NCLEX-RN passing standards for nursing programs”
- Foreman, 2019, “Reliability and Validity of NCLEX-RN State Pass Rate Standards”
How to cite this page
Attribution details, provided for anyone quoting or referencing this material.
APA
Castleport Test Prep Editorial Team. (2026). NCLEX pass rates by nursing school: 2025 data. Castleport Test Prep. https://castleporttestprep.com/research/nclex-pass-rates-by-nursing-school/
MLA
Castleport Test Prep Editorial Team. “NCLEX Pass Rates by Nursing School: 2025 Data.” Castleport Test Prep, 2026, castleporttestprep.com/research/nclex-pass-rates-by-nursing-school/.
Chicago
Castleport Test Prep Editorial Team. “NCLEX Pass Rates by Nursing School: 2025 Data.” Castleport Test Prep. Last verified August 4, 2026. https://castleporttestprep.com/research/nclex-pass-rates-by-nursing-school/
Dataset
Castleport Research. Michigan 2025 NCLEX Program Outcomes and Wilson Interval Dataset. Version 1.1, last verified August 4, 2026. Castleport Test Prep.
Data note. Table 1, Table 4, and Table 6 contain Castleport calculations applied to published official figures. Tables 2, 3, 5, and 7 compile figures or rules from the named issuing bodies. Wilson intervals use 95% confidence and z = 1.96.
Castleport Test Prep is an independent publisher of exam preparation. Its Research section assembles and documents primary-source exam and licensure data for public reference.
Last verified: August 4, 2026.