Last verified: August 6, 2026 · By Castleport Test Prep Editorial Team
The latest NAVLE pass rates by veterinary school show a median of 93% across 32 U.S. schools with an official 2025 or 2024–25 figure we could verify. Rates ran from 72% to 98%. Thirty-one of 32 reported a rate at or above the AVMA Council on Education's 80% benchmark. ICVA's national ultimate rate for 2024–25 was 89%.
Only 14 of the 32 schools publish the exact number of students who took the exam. That matters because the AVMA's below-80% confidence-interval check cannot be reproduced from a rounded rate alone.
These are official school-reported figures. Schools use different periods, labels, attempt rules, and counting rules. This is a source-checked reference, not a school-quality score.
Data files: School-level CSV · Calculated boundary CSV · Calculated boundary chart
NAVLE pass-rate statistics at a glance
Across the 32 verified numeric rows, the median was 93%, the unweighted mean was 92.2%, and the range was 72%–98%. The summary below is calculated from the school-reported figures in Table 1.
| Measure | Result |
|---|---|
| U.S. programs in scope | 33 |
| Official numeric rates verified | 32 |
| Median school-reported rate | 93% |
| Unweighted mean of school rates | 92.2% |
| Range | 72%–98% |
| Middle half of schools | 90.75%–96.25% |
| At or above the AVMA's stated 80% benchmark | 31 of 32 |
| At or above the 89% national ultimate rate | 26 of 32 |
| Exact exam-taker or exam-sitter count published | 14 of 32 |
| Class size published instead of an exam-taker count | 3 of 32 |
| No denominator published | 15 of 32 |
| ICVA national ultimate rate, 2024–25 | 89% |
Source: Castleport Test Prep calculations from the official school rows below. The quartiles use linear interpolation, the same convention as Excel QUARTILE.INC. Verified August 6, 2026.
What are the latest NAVLE pass rates by veterinary school?
Thirty-two of the 33 U.S. programs in this snapshot had a numeric 2025 or 2024–25 rate we could retrieve from an official school page. The median was 93%. Western University of Health Sciences had an official outcomes page, but its current figure did not render during verification, so that row stays blank and is excluded from every calculation.
This snapshot covers U.S. AVMA-accredited programs with a graduating class in the common 2025 or 2024–25 period and an official outcomes or accreditation page located during the review. New programs without a graduating class in that period are outside this snapshot.
Table 1. NAVLE pass rates by veterinary school, United States
| Veterinary school | State | Period | Rate | Published count | Measure note |
|---|---|---|---|---|---|
| Auburn University | AL | Class of 2025 | 97% | Not published | Class of 2025 rate; attempt basis not stated |
| Colorado State University | CO | 2025 | 93% | 135 passing / 145 taking | Students taking and passing; attempt basis not stated |
| Cornell University | NY | 2024–25 | 97% | Not published | Cornell rate shown beside the ICVA criterion-group rate; attempt basis not separately stated |
| Iowa State University | IA | 2025 | 95% | Not published | 2025 rate; attempt basis not stated |
| Kansas State University | KS | Class of 2025 | 97% | Not published | Class of 2025 rate; attempt basis not stated |
| Lincoln Memorial University | TN | 2024–25 | 89% | 108 passing / 121 taking | Students taking and passing; displayed rate is rounded |
| Long Island University | NY | 2024–25 | 90% | Not published | 2024–25 rate; attempt basis not stated |
| Louisiana State University | LA | Class of 2025 | 85% | Not published | Class of 2025 rate; attempt basis not stated |
| Michigan State University | MI | Class of 2025 | 85% | Not published | Class of 2025 rate; attempt basis not stated |
| Midwestern University | AZ | Class of 2025 | 92% | Not published | Class of 2025 rate; attempt basis not stated |
| Mississippi State University | MS | 2025 | 95% | Not published | Pass rate at time of graduation |
| North Carolina State University | NC | 2025 | 93% | 90 passing / 97 taking | Students taking and passing; attempt basis not stated |
| Oklahoma State University | OK | 2025 | 97% | 99 passing / 102 taking | Students taking and passing; attempt basis not stated |
| Oregon State University | OR | Graduating class of 2025 | 92% | Not published | Graduating class of 2025; attempt basis not stated |
| Purdue University | IN | Class of 2025 | 93% | 69 passing; class size 74 | PVM Ultimate Pass Rate; denominator shown is class size |
| Texas A&M University | TX | 2025 | 96% | 154 passing / 161 taking | Students taking and passing; displayed rate is rounded |
| Texas Tech University | TX | Inaugural Class of 2025 | 97% | Class size 61 | Inaugural class of 2025; denominator shown is class size |
| The Ohio State University | OH | 2024–25 | 87% | 143 passing / 165 taking | Students taking and passing; displayed rate is rounded |
| Tufts University | MA | 2025 | 97% | 99 passing / 102 taking | Students taking and passing; displayed rate is rounded |
| Tuskegee University | AL | 2025 | 72% | Not published | 2025 rate; attempt basis not stated |
| University of Arizona | AZ | Class of 2025 | 83% | Class size 107 | Class of 2025 rate; denominator shown is class size, not exam takers |
| University of California, Davis | CA | 2024–25 | 92% | 130 passing / 141 taking | Students taking and passing; attempt basis not stated |
| University of Florida | FL | Graduating class of 2025 | 92% | Not published | Pass rate at graduation |
| University of Georgia | GA | 2024–25 | 93% | 137 passing / 148 taking | Students taking and passing; displayed rate is rounded |
| University of Illinois | IL | 2024–25 | 88% | Not published | Senior class passing by graduation |
| University of Minnesota | MN | 2025 | 91% | Not published | 2025 rate; attempt basis not stated |
| University of Missouri | MO | 2025 | 96% | 107 passing / 111 taking | Ultimate pass rate, combined December and April |
| University of Pennsylvania | PA | Class of 2025 | 95% | 125 passing / 132 taking | Pass rate at time of graduation |
| University of Tennessee | TN | Class of 2025 | 94% | 81 passing / 86 sitting | Students sitting and passing; attempt basis not stated |
| University of Wisconsin–Madison | WI | 2025 | 97% | Not published | 2025 rate; attempt basis not stated |
| Virginia–Maryland College of Veterinary Medicine | VA | 2024–25 | 93% | 113 passing / 121 taking | Students taking and passing; displayed rate is rounded |
| Washington State University | WA | 2025 | 98% | 121 passing / 123 taking | Students taking and passing; displayed rate is rounded |
| Western University of Health Sciences | CA | Official page found; current number not retrievable | — | Not published | Official outcomes page found; current figure did not render during verification |
Source: the official school page linked in each row. Verified August 6, 2026. The downloadable CSV keeps the full source URL, denominator type, measure note, and verification date.
A note on Western University. We found its official outcomes page. No current number appeared in the rendered or indexed content we could retrieve. We left the value blank instead of filling it from an unofficial chart. A missing number is honest. A borrowed number is not.
Newer U.S. figures kept separate
Two U.S. schools already show a newer result. We keep those numbers out of the main 2025 or 2024–25 snapshot so the summary does not mix periods.
| School | Newer period | Newer result | Why it stays separate |
|---|---|---|---|
| University of California, Davis | 2025–26 | 93.7% (133 of 142 taking) | Newer cycle than the main row |
| Purdue University | Class of 2026 | 95% (76 passing; class size 80) | Newer class, and the denominator is class size |
Source: the two official school pages linked above. Verified August 6, 2026.
What do the NAVLE pass rate statistics show?
The published rates are generally high: 31 of 32 were at or above 80%, and the median was 93%. They do not tell you which school is better. The schools are not measuring the same group over the same period, and 18 of the 32 rows do not publish an exact exam-taker denominator.
Three facts belong together:
- We verified that each numeric rate appears on an official school page. When a source gives exact exam-taker counts, the arithmetic reconciles with the displayed rate after rounding.
- The rates are not cleanly comparable. A calendar-year rate, a graduating-class rate, an ultimate rate, and a rate “at graduation” can describe different groups.
- A rounded percentage without a numerator and denominator cannot reproduce the AVMA's confidence-interval calculation.
That is why this page publishes the rate, period, count type, source wording, and source URL in the same row.
What does the AVMA's 80% NAVLE benchmark mean?
The AVMA Council on Education says it expects at least 80% of each college's graduating seniors who sit for the NAVLE to have passed by graduation. A result below 80% is not an automatic consequence. The Council's evaluation rubric says it calculates a 95% exact binomial confidence interval when a college is below 80%.
For a college with a reported pass rate below 80%, an upper limit below 85% for two successive years leads to Probationary Accreditation. Four successive years meeting both conditions lead to Terminal Accreditation.
The rule in plain words
A confidence interval puts a range around a pass rate. A small group gets a wider range. A large group gets a tighter range.
For a reported rate below 80%, the policy asks whether the upper end of that range is still at least 85%. If it is, the result does not meet the stated upper-limit condition. If the reported rate is below 80% and the upper end is below 85%, the year can count in the two-year or four-year sequence.
Table 2. Castleport's calculated boundary by exam-taker count
The AVMA policy names a “95% exact binomial confidence interval,” but the public wording does not state whether the upper endpoint is taken from a two-sided 95% interval or a one-sided 95% limit. The main table below uses the standard two-sided Clopper–Pearson interval. It is our reproduction of the written rule, not an AVMA-issued table.
| Students who took the NAVLE | Minimum passes that do not meet both stated conditions | Rate | What stops the sequence |
|---|---|---|---|
| 25 | 17 | 68.00% | Upper exact limit reaches 85% |
| 50 | 37 | 74.00% | Upper exact limit reaches 85% |
| 75 | 57 | 76.00% | Upper exact limit reaches 85% |
| 100 | 78 | 78.00% | Upper exact limit reaches 85% |
| 125 | 98 | 78.40% | Upper exact limit reaches 85% |
| 150 | 119 | 79.33% | Upper exact limit reaches 85% |
| 175 | 139 | 79.43% | Upper exact limit reaches 85% |
| 190 | 152 | 80.00% | The reported rate is not below 80% |
| 200 | 160 | 80.00% | The reported rate is not below 80% |
Source: Castleport Test Prep calculation from the AVMA COE policy and evaluation rubric. Method: Clopper–Pearson two-sided exact interval, alpha 0.05. Verified August 6, 2026. Download all 236 exam-group sizes.
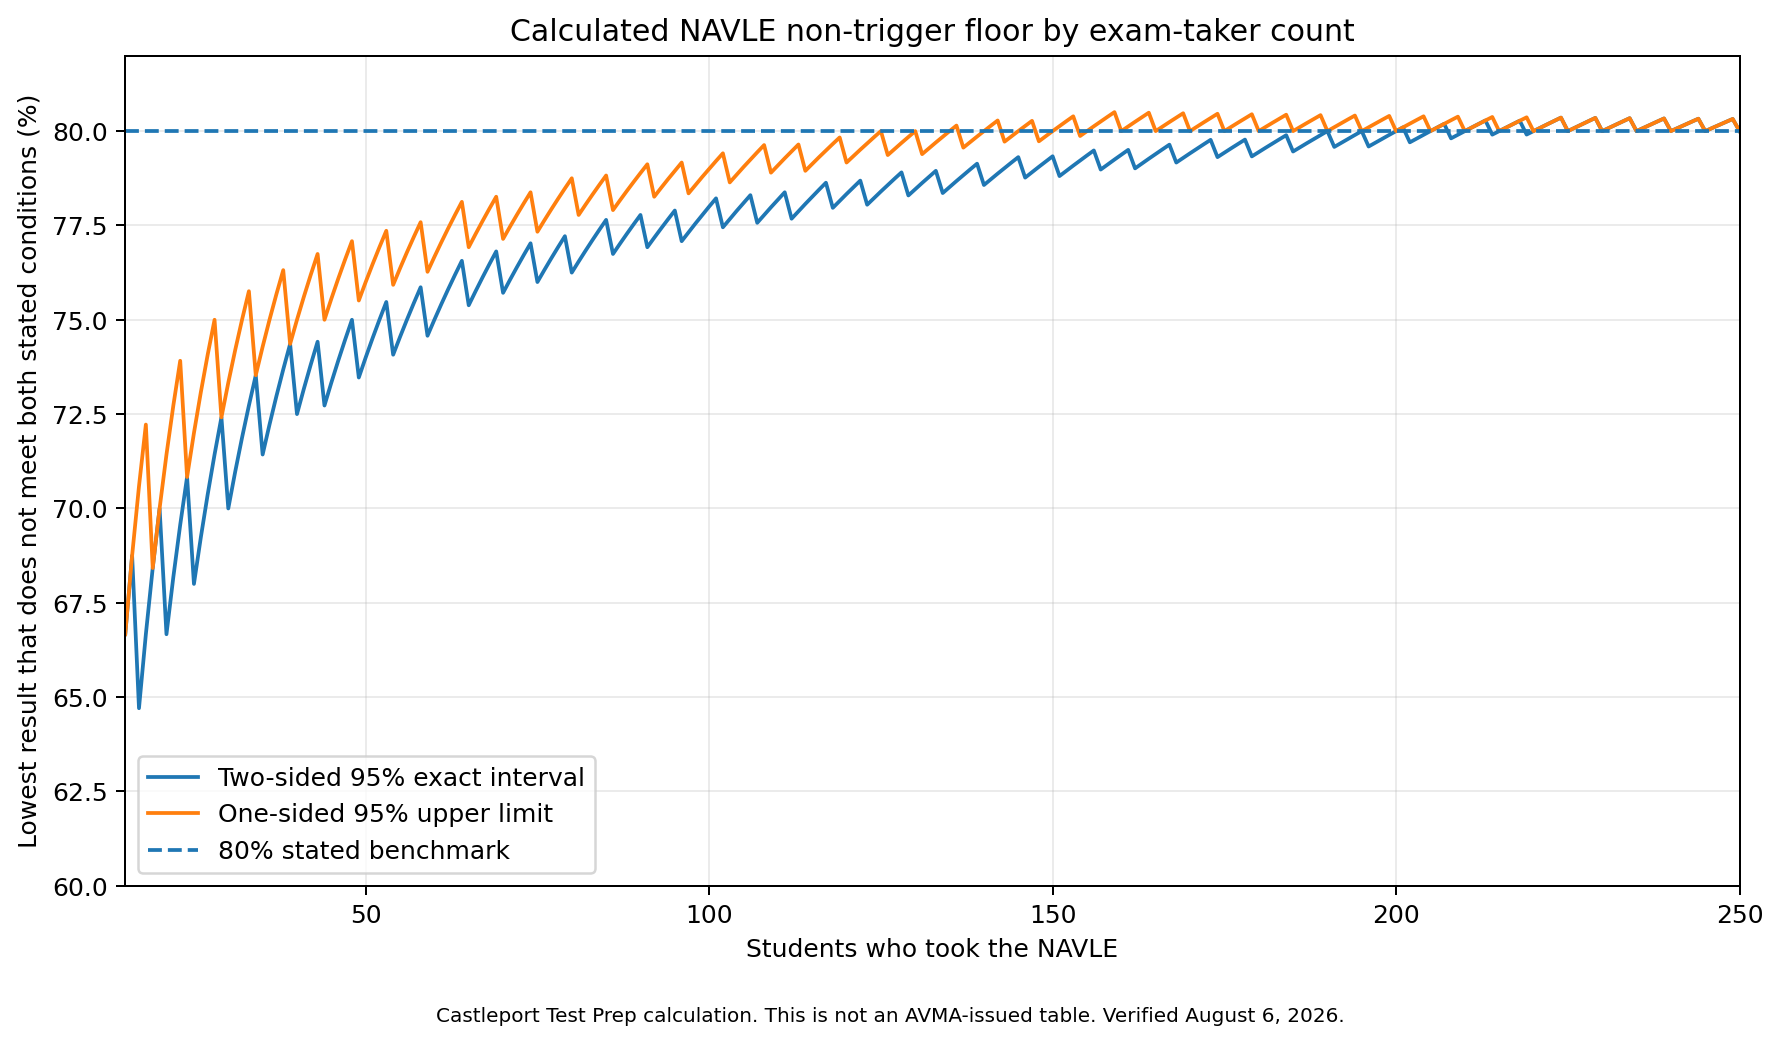
The line is bumpy because a class cannot have part of a passing student. At 25 students, 17 passes is 68%. At 30 students, the two-sided result moves back to 70%. The steps get smaller as the group gets larger.
The method choice matters. At 30 exam takers, the two-sided calculation gives 70.00%. A one-sided 95% upper limit gives 73.33%. Both versions are in the downloadable file so the assumption is visible.
Can NAVLE pass rates tell you which veterinary school is better?
Not by themselves. Among the 14 U.S. schools that publish exact exam-taker or exam-sitter counts, the median 95% interval is 9.1 percentage points wide. Of the 91 possible school pairs, 87 pairs have overlapping individual intervals.
That overlap is descriptive. It is not a formal pairwise test, and it does not prove that two schools are tied. It does show that the uncertainty around many rates is large compared with the small gaps between them.
Table 3. Exact 95% ranges for schools with exam-taker counts
| Veterinary school | Passed / took | Rate from counts | Exact 95% range | Width |
|---|---|---|---|---|
| Washington State University | 121 / 123 | 98.4% | 94.2%–99.8% | 5.6 points |
| Oklahoma State University | 99 / 102 | 97.1% | 91.6%–99.4% | 7.7 points |
| Tufts University | 99 / 102 | 97.1% | 91.6%–99.4% | 7.7 points |
| University of Missouri | 107 / 111 | 96.4% | 91.0%–99.0% | 8.0 points |
| Texas A&M University | 154 / 161 | 95.7% | 91.2%–98.2% | 7.0 points |
| University of Pennsylvania | 125 / 132 | 94.7% | 89.4%–97.8% | 8.5 points |
| University of Tennessee | 81 / 86 | 94.2% | 87.0%–98.1% | 11.1 points |
| Virginia–Maryland College of Veterinary Medicine | 113 / 121 | 93.4% | 87.4%–97.1% | 9.7 points |
| Colorado State University | 135 / 145 | 93.1% | 87.7%–96.6% | 9.0 points |
| North Carolina State University | 90 / 97 | 92.8% | 85.7%–97.0% | 11.4 points |
| University of Georgia | 137 / 148 | 92.6% | 87.1%–96.2% | 9.1 points |
| University of California, Davis | 130 / 141 | 92.2% | 86.5%–96.0% | 9.6 points |
| Lincoln Memorial University | 108 / 121 | 89.3% | 82.3%–94.2% | 11.8 points |
| The Ohio State University | 143 / 165 | 86.7% | 80.5%–91.5% | 10.9 points |
Source: exact counts on the official school pages linked above. Castleport Test Prep calculated two-sided Clopper–Pearson 95% intervals. Verified August 6, 2026.
Four pairs have non-overlapping individual intervals: Ohio State–Oklahoma State, Ohio State–Tufts, Ohio State–Washington State, and Lincoln Memorial–Washington State. That is still not a substitute for a planned comparison that controls for period, student mix, attempt basis, and other differences.
Which school reported the lowest NAVLE pass rate?
Tuskegee University reported 72% for 2025, the only rate below 80% in this U.S. snapshot. Tuskegee did not publish the numerator or the number of students who took the exam, so the public cannot reproduce the confidence-interval check for that result.
The AVMA's June 17, 2026 accreditation action continued Tuskegee on Probationary Accreditation. The AVMA listed major deficiencies under Standard 4, Clinical Resources, and Standard 11, Outcomes Assessment. The public sources do not show that the single 72% figure caused that status, and the Council sees information that is not public.
Table 4. Why the missing denominator changes the calculation
These are examples only. They are not Tuskegee's hidden counts.
| Hypothetical exact result | Exact rate | Two-sided 95% upper limit | Meets the stated upper-limit-below-85% condition? |
|---|---|---|---|
| 18 of 25 | 72.00% | 87.9% | No |
| 36 of 50 | 72.00% | 83.8% | Yes |
| 72 of 100 | 72.00% | 80.5% | Yes |
Source: Castleport Test Prep calculation using the same two-sided exact method as Table 2. These are hypothetical examples, not Tuskegee data.
How many schools publish enough to reproduce the calculation?
| Public denominator detail | Schools | Share of 32 numeric U.S. rows |
|---|---|---|
| Exact exam-taker or exam-sitter count | 14 | 43.8% |
| Class size only | 3 | 9.4% |
| No denominator | 15 | 46.9% |
Source: Castleport Test Prep review of the official school pages in Table 1. Percentages may total 100.1% because of rounding.
The AVMA annual reporting guidance requires a public link where a college's accreditation information and NAVLE pass rate are available. It does not require a public numerator, denominator, or common table format. That is why 18 of 32 numeric rows do not provide an exact exam-taker count.
What is the national NAVLE pass rate?
ICVA prints an 89% national “ultimate performance passing rate” for senior students at AVMA-accredited schools in 2024–25. The same official report supports two other rates: 81.64% for criterion-group test administrations across both windows and 65.84% for all test administrations. The three numbers count different things.
Table 5. Three national NAVLE rates for 2024–25
| Measure | Rate | What it counts |
|---|---|---|
| Ultimate performance passing rate | 89% | Senior students from AVMA-accredited schools; ICVA says the ultimate measure includes second-take information for repeat candidates |
| Criterion-group administration pass rate | 81.64% | First-time senior students at accredited schools testing under standard conditions: 1 − 914 failing / 4,977 administrations |
| All-administration pass rate | 65.84% | Every examinee group in both windows: 1 − 3,177 failing / 9,301 administrations |
Source: ICVA 2025 Report to Licensing Boards, pp. 3–4, and the ICVA 2024–25 Annual Report. The 89% figure is printed. Castleport calculated 81.64% and 65.84% from the published combined counts. Verified August 6, 2026.
That is a spread of about 23.2 percentage points. The 89% number is rounded, so a more exact spread cannot be claimed from the public figure.
Use 89% when comparing with a school source that clearly reports an ultimate or by-graduation measure. Use 81.64% when the question is about first-time criterion-group administrations under standard conditions. Use 65.84% only when the question is about all test administrations across all groups.
Table 6. National ultimate performance passing rate by cycle
| Testing cycle | Rate |
|---|---|
| 2020–21 | 92% |
| 2021–22 | 90% |
| 2022–23 | 86% |
| 2023–24 | 88% |
| 2024–25 | 89% |
Source: ICVA's 2025 Report to Licensing Boards and 2026 Report for Veterinary Schools. Verified August 6, 2026.
One printed percentage does not match its own counts
The Spring 2025 criterion-group row prints 94 failing administrations out of 319 and a failure rate of 39.5%. But 94 divided by 319 is 29.47%.
The combined criterion-group row is internally consistent: 914 failing out of 4,977 equals 18.36%, which rounds to the printed 18.4%. We use that combined row for the 81.64% calculation above.
We do not know which Spring field is wrong. This is our arithmetic on the published table, not a correction issued by ICVA.
Why are school-level NAVLE rates not cleanly comparable?
The 32 school rows use several time frames, several measure labels, and three denominator situations. Two schools can show the same percentage while measuring different groups over different months.
Table 7. The comparison problems found in the official disclosures
| Issue | What appeared in the source pages | Why it matters |
|---|---|---|
| Time frame | Calendar year, testing cycle, graduating class, or inaugural class | The groups overlap, but they are not identical |
| Attempt basis | Ultimate, at graduation, by graduation, or not stated | A later passing attempt can change the rate |
| Denominator | Exact exam takers, class size, or no denominator | Class size is not the same as exam takers, and a missing denominator blocks reproduction |
| Rounding | Whole-number rates beside exact counts | The rate from counts can differ by several tenths from the displayed rate |
| Reporting system | Older annual or class measures versus newer per-window school reports | A 2025–26 window result may not line up with an older annual result |
Source: Castleport Test Prep classification of the official disclosures in Table 1 and ICVA's 2026 school-report update. Verified August 6, 2026.
The safest way to use a school rate is to quote the school's period and label with the number. Do not strip those words away.
How was this NAVLE pass-rate dataset built?
We read each school's official accreditation, outcomes, admissions, or program page. We recorded the rate, period, source wording, numerator, denominator, denominator type, URL, and verification date. Missing values stay missing.
Our rules:
- One common-period row per U.S. school. We used the most recent 2025 or 2024–25 result that fit the snapshot. Newer results stay in a separate field.
- No invented attempt labels. We preserve an exact label when the school gives one. When the source is silent, the dataset says “attempt basis not stated.”
- Counts appear only when the official source publishes them. We never work backward from a rounded rate to guess a numerator.
- Class size stays separate from exam takers. Purdue, Arizona, and Texas Tech publish class size in the cited rows. Those three rows are not used in the exact-count interval table.
- No unofficial source fills a gap. Western University's value remains blank.
- Every source carries a verification date. The current review date is August 6, 2026.
How the original statistics were calculated
- Median and mean: calculated from the 32 displayed U.S. rates.
- Middle half: 25th and 75th percentiles using linear interpolation, matching Excel
QUARTILE.INC. - Pooled exact-count subgroup: 1,642 passing out of 1,755 exam takers or sitters across the 14 schools with exact counts, or 93.6%. This is a student-weighted result for that subgroup only.
- School intervals: two-sided 95% Clopper–Pearson exact intervals from the 14 exact numerator-and-denominator pairs.
- Boundary table: the smallest whole-number pass result that does not meet both written conditions at each exam-taker count from 15 through 250.
For a group of n students with x passes, the two-sided upper endpoint is the 97.5th percentile of a Beta(x + 1, n − x) distribution. In R: qbeta(0.975, x + 1, n - x). In Python: scipy.stats.beta.ppf(0.975, x + 1, n - x).
We checked the interval calculations with SciPy's beta quantile, the equivalent F-distribution formula, and the statsmodels beta interval. They agreed to at least ten decimal places on the rows tested.
Update schedule
We recheck the school rows after new school-report releases and recheck accreditation status after AVMA Council on Education action notices. Newer periods stay separate until a clear common comparison period exists. The visible verification date changes only after the sources are checked again.
What changed in NAVLE reporting in 2025–26?
Beginning with the 2025–26 cycle, ICVA moved from two testing windows to three. School reports now come after each administration instead of as one collated report at the end of the cycle. ICVA also changed the school-report categories to include all senior students at accredited schools, including students testing with accommodations or non-standard conditions.
Those changes make a simple before-and-after school comparison harder.
- Three windows: October–November, March, and July–August.
- Per-window school reports: ICVA says school performance information is provided by individual testing window beginning with October–November 2025.
- Changed report population: all seniors at accredited schools are now included in the school-report category.
- Large first window: ICVA reported 6,730 test administrations in October–November 2025, compared with 9,301 administrations during the full 2024–25 cycle.
Source: ICVA 2026 Report for Veterinary Schools.
Other current NAVLE changes
- Exam fee: ICVA lists $825 for the 2026–27 cycle, plus $395 for selected test centers outside the United States or Canada.
- Exam structure: Beginning with the October–November 2026 window, the exam keeps 360 items but moves from 6 blocks of 60 items to 12 blocks of 30. Standard block time moves from 65 minutes to 33 minutes, and the listed exam-day length moves from 7 hours 30 minutes to 7 hours 36 minutes. ICVA structure update.
- Independent audit: ICVA says Dorsey & Whitney LLP is managing the process, ACS Ventures is conducting it, and completion is expected in the first quarter of 2027. ICVA audit update.
- Practice analysis: ICVA's published project schedule places production of a final blueprint and project report in October 2026. ICVA annual report.
What do Canadian and Caribbean veterinary schools report?
AVMA-accredited schools outside the United States publish NAVLE results too. We keep them separate because country, school calendar, and school-defined measures add another layer of difference.
Table 8. Canadian and Caribbean school disclosures
| School | Country | Period | Rate | Published count | Measure note |
|---|---|---|---|---|---|
| Atlantic Veterinary College | Canada | 2024–25 | 91% | Not published | 2024–25 rate; attempt basis not stated |
| Ontario Veterinary College | Canada | Graduation 2025 | 97% | Not published | Pass rate at graduation |
| University of Calgary | Canada | 2025 | 100% | 47 passing / 47 taking | Ultimate rate; the source also reports a 98% first-attempt rate |
| Université de Montréal | Canada | 2024–25 | 100% | Not published | 2024–25 rate; attempt basis not stated |
| Western College of Veterinary Medicine | Canada | 2024–25 | 94% | Not published | 2024–25 rate; attempt basis not stated |
| St. George’s University | Grenada | 2024–25 | 86.6% | Not published | Custom school calculation for two graduating classes |
| Ross University | Saint Kitts and Nevis | 2024–25 | 89% | Not published | Custom school calculation: first fall attempt, counted as passing if passed in fall or on a spring repeat |
Source: the official school page linked in each row. Verified August 6, 2026.
Ross University says its measure starts with students taking the fall exam for the first time and counts them as passing if they pass in the fall or on a spring repeat. St. George's University says it calculates its own rate from ICVA reports because it has January and June graduating classes.
The University of Calgary shows why labels matter. It publishes both a 98% first-attempt rate and a 100% ultimate rate for 2025. One school, one year, two useful numbers answering different questions.
What this data does not show
This dataset shows what each official page reported and how the published rows compare. It does not audit student records, make unlike school measures identical, or turn the rates into a school-quality score.
We would rather put the weak points in plain sight.
- The figures are school-reported. We verified that an official page published each number. We did not audit the underlying student records.
- The 92.2% mean is unweighted. It treats a small program and a large program the same. The 93.6% pooled rate applies only to the 14-school exact-count subgroup.
- Attempt basis is often missing. Several schools say “ultimate” or “at graduation.” Many do not say whether the figure is first-attempt or ultimate.
- Periods do not match perfectly. “Class of 2025,” “2025,” and “2024–25” are related but not identical.
- The AVMA calculation details are not fully public in the cited wording. Our main boundary table uses a two-sided Clopper–Pearson interval. A one-sided 95% upper limit produces a different boundary.
- Accreditation status can change. The Tuskegee status on this page was checked against the June 17, 2026 action notice.
- Western University's value is missing. Its official page did not yield a retrievable current figure during this review.
- This page is educational reference material. Accreditation decisions belong to the AVMA Council on Education. Licensing decisions belong to state and provincial boards.
Frequently asked questions about NAVLE pass rates
The answers below separate school-reported rates, national rates, first-attempt measures, ultimate measures, and the AVMA accreditation rule. Each answer uses the same definitions and source dates as the tables above.
What is a good NAVLE pass rate for a veterinary school?
In this 32-school U.S. snapshot, the median was 93% and the middle half ran from 90.75% to 96.25%. A result in the low 90s sits near the middle of this snapshot. The AVMA Council on Education’s stated benchmark is 80%, and 31 of 32 published rates were at or above it.
What was the national NAVLE pass rate in 2025?
ICVA reported an 89% ultimate performance passing rate for senior students at AVMA-accredited schools for the 2024–25 cycle. Its examinee-group table also supports an 81.64% pass rate for criterion-group test administrations across both windows.
Do veterinary schools have to publish their NAVLE pass rates?
The AVMA Council on Education’s annual reporting guidance requires each accredited college to provide a public link where its accreditation information and NAVLE pass rate are available. The rule does not require one standard format or a public numerator and denominator.
Are school NAVLE rates first-attempt or ultimate rates?
It depends on the school. Some sources say “ultimate” or “at graduation.” Many do not state the attempt basis. The main table preserves the source’s wording and does not assign an attempt type when the source is silent.
Can NAVLE pass rates tell you which veterinary school is better?
Not by themselves. The schools use different periods, labels, attempt rules, and denominators. Among the 14 U.S. schools with exact exam-taker counts, the median 95% interval was 9.1 percentage points wide, so many small raw gaps sit inside broad uncertainty ranges.
What happens when a veterinary school reports below 80%?
A rate below 80% does not create an automatic consequence. The AVMA Council on Education says it calculates a 95% exact binomial confidence interval for a college below 80%. Two successive years with both a reported rate below 80% and an upper limit below 85% lead to Probationary Accreditation; four successive years meeting both conditions lead to Terminal Accreditation.
Which U.S. veterinary school reported the highest rate in this snapshot?
Washington State University reported the highest verified U.S. figure in this snapshot: 98% for 2025, based on 121 students passing out of 123 taking the exam. That does not make it a school-quality score, because the periods and measures are not uniform.
Where are school-level NAVLE pass rates published?
The public ICVA reports cited here provide national figures and examinee-group tables. The school-level rows on this page come from each veterinary school’s own accreditation, outcomes, admissions, or program page.
How many people take the NAVLE each year?
ICVA reported 9,301 test administrations in the 2024–25 cycle. That is a count of administrations, not necessarily unique people, because some candidates take the exam more than once. ICVA also reported 6,730 administrations in the October–November 2025 window.
How to cite this page
Castleport Test Prep Editorial Team. “NAVLE Pass Rates by Veterinary School: 2025–26 Data.” Castleport Test Prep. Last updated August 6, 2026. https://castleporttestprep.com/research/navle-pass-rates-by-veterinary-school/
The school-level CSV includes the source URL and verification date for each row. The calculated boundary CSV includes both the two-sided and one-sided methods.
Who made this page, and why?
Castleport Test Prep publishes research and reference pages about exams and the bodies that oversee them. This page was produced by Castleport Test Prep Editorial Team. It is not an AVMA or ICVA publication.
We built it because the school-level figures were spread across more than 30 official pages, with different labels and different amounts of detail. The useful work is not repeating one rate. It is keeping the source, period, denominator, measure label, and calculation method together.
Everything on this page is meant to be checkable. Where a source did not support a number or label, we left it out.
There are no products, recommendations, or exam-prep advice on this page.
Last verified: August 6, 2026.
Primary sources
The school table uses each school’s own page. The accreditation rule comes from the AVMA Council on Education, and the national figures and reporting changes come from ICVA.
- AVMA COE accreditation principles and Standard 11
- AVMA COE comprehensive site-visit evaluation rubric
- AVMA COE annual interim report guidance
- AVMA accredited veterinary colleges directory
- AVMA June 2026 accreditation actions
- AVMA June 2026 deficiencies cited
- ICVA 2025 Report to Licensing Boards
- ICVA 2024–25 Annual Report
- ICVA 2026 Report for Veterinary Schools
- ICVA NAVLE structure update
- ICVA independent-audit update
- Individual veterinary school sources are linked in Tables 1 and 8 and stored in the school-level CSV.