Vet School Acceptance Rates: 35 U.S. Schools on One Measure
At the median of 35 U.S. vet schools, there were 7.2 first-year seats per 100 applicants for AAVMC's Class of 2029. That's 13.9 applicants per seat, according to Castleport Test Prep's September 2026 analysis of AAVMC data. These are seat ratios, not admission-offer rates. Each school's counts and residency split are below.
Below: vet school acceptance rates explained, 35 schools on the same seat measure, residency gaps up to about 21 times, and where the famous "10–15%" claim comes from.
Data files: School table (CSV) · School-published counts (CSV) · National figures (CSV) · How to cite
Key vet school acceptance rate statistics
- At the median of 35 U.S. vet schools, there were 7.2 first-year seats per 100 applicants for AAVMC's Class of 2029, or 13.9 applicants per seat (Castleport Test Prep analysis of AAVMC data).
- 26 of 35 schools had fewer than 10 first-year seats per 100 applicants for AAVMC's Class of 2029; 6 had 10 to 15, and 3 had more than 15 (Castleport Test Prep analysis of AAVMC data).
- Applicants per first-year seat ranged from 3.1 at Tuskegee to 25.3 at Wisconsin–Madison for AAVMC's Class of 2029, an 8.1-fold spread computed from the raw counts (Castleport Test Prep analysis of AAVMC data).
- Among the same 33 schools with usable residency pairs, the median was about 23.3 seats per 100 resident applicants and 3.7 per 100 non-resident applicants for AAVMC's Class of 2029 (Castleport Test Prep calculations from AAVMC's rounded residency ratios).
- At 12 of 33 U.S. vet schools with usable paired residency data, the non-resident applicant-per-seat ratio was at least 10 times the resident ratio for AAVMC's Class of 2029; Purdue's gap was about 21.2-fold, the largest usable pair (Castleport Test Prep analysis of AAVMC data).
- 13,174 people applied for the Class of 2030, according to the AAVMC 2025–2026 Annual Data Report. This is an applicant count, not an acceptance rate.
- Vet school applicants apply to 5 to 6 schools per cycle on average, according to AAVMC's 2026 report.
- At the University of Tennessee, applicants more than doubled from 1,067 in 2018–19 to 2,339 in 2024–25 (up 119%), while students accepting offers rose from 85 to 99 (up 16%) (Castleport Test Prep calculations from Tennessee's admissions statistics).
- UC Davis offered admission to 168 of 2,158 completed applicants (7.8%) for its Class of 2029: 13.7% of California applicants and 3.2% of out-of-state applicants (Castleport Test Prep calculations from the UC Davis admission profile).
- Colorado State reports 3,410 applicants for a 174-person first-year Doctor of Veterinary Medicine (DVM) class, or 5.1 class places per 100 applicants (Castleport Test Prep calculation from the DVM Student Snapshot, checked September 29, 2026; the snapshot does not name the cohort year).
- NC State's applications rose 34%, from 2,150 in its 2025 reporting year to 2,885 in 2026; non-residents accounted for 710 of the 735 added applications (96.6%) (Castleport Test Prep calculations from NC State's admissions FAQ).
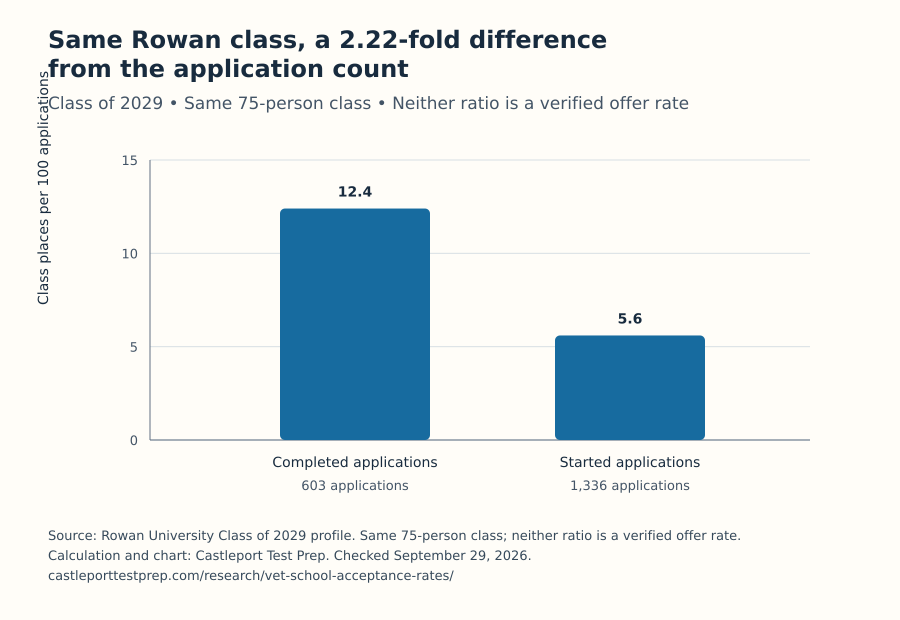
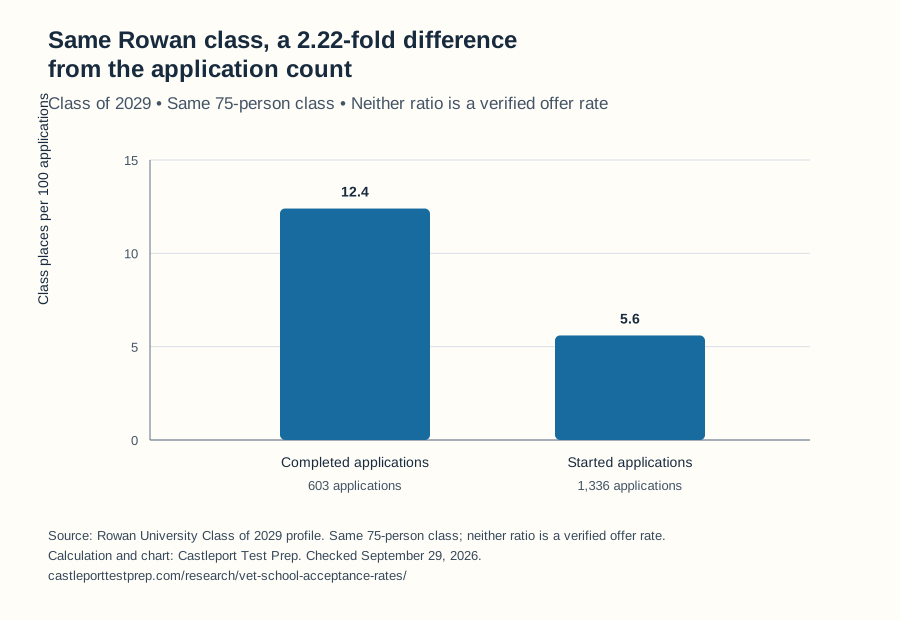
- Rowan's same 75-person class produces ratios of 12.4 per 100 completed applications or 5.6 per 100 started applications—a 2.22-fold difference from the denominator alone (Castleport Test Prep analysis of Rowan's Class of 2029 profile). Neither is a verified count of all admission offers.
- U.S. MD medical schools enrolled 23,440 first-year students from 54,699 applicants in 2025–26, or 42.9 per 100 (Castleport Test Prep calculation from AAMC's data tables). A matched national vet-school outcome rate was not verified, so this does not establish which is harder to enter.
Vet school acceptance rates by school (35 U.S. schools)
For AAVMC's Class of 2029, the 35 schools in the table had between 3.1 and 25.3 applicants per first-year seat, with a median of 13.9. That works out to 4.0 to 32.0 seats per 100 applicants. Source: AAVMC; calculations: Castleport Test Prep.
Here's the measure in plain words. Take the number of first-year spots a school had. Divide by the number of people who applied there. Multiply by 100. That's "seats per 100 applicants."
It counts seats, not offers. A school can make more offers than it has seats because some people choose another school. At UC Davis, the Class of 2029 profile lists 168 offers and 154 accepted offers. Those are separate from its class total of 155, which includes one deferred student (UC Davis).
Why one source for every row? The American Association of Veterinary Medical Colleges (AAVMC) publishes a school-by-school comparison using one named measure. We read the counts and ratios in the live report linked from its Public Data page. The workbook is labeled “2026 AAVMC Annual Data Report - Draft.” All rows below use its Class of 2029 label. That gives a shared measure, not proof that each school uses identical application rules.
The table covers 35 schools in that report, not every program on the current accreditation list. Exact overall counts are in the CSV. Residency values are approximate calculations from ratios AAVMC rounds to one decimal.
Use the table below to find your schools. Switch the view to in-state or out-of-state to see the number that fits you.
Row order measures applications per seat, not school quality or personal odds. Residency seats per 100 are approximate inverses of AAVMC's rounded ratios.
Showing 35 of 35 schools.
| Order | School | State | Applicants per seat | Seats per 100 applicants | Resident seats per 100 (approx.) | Non-resident seats per 100 (approx.) | Non-resident ratio ÷ resident ratio (approx.) |
|---|---|---|---|---|---|---|---|
| 1 | WI | 25.3 | 4.0 | 24.4 | 1.6 | 15.0× | |
| 2 | AZ | 24.5 | 4.1 | 28.6 | 1.8 | 15.7× | |
| 3 | TN | 23.2 | 4.3 | 28.6 | 1.4 | 20.6× | |
| 4 | IN | 22.8 | 4.4 | 33.3 | 1.6 | 21.2× | |
| 5 | OR | 22.4 | 4.5 | 32.3 | 2.3 | 13.7× | |
| 6 | CO | 20.5 | 4.9 | 27.0 | 2.6 | 10.3× | |
| 7 | OH | 19.0 | 5.3 | 20.4 | 3.3 | 6.2× | |
| 8 | GA | 18.3 | 5.5 | 23.3 | 2.2 | 10.8× | |
| 9 | VA | 17.9 | 5.6 | 14.7 | 2.6 | 5.7× | |
| 10 | WA | 17.6 | 5.7 | 28.6 | 3.7 | 7.7× | |
| 11 | IL | 17.3 | 5.8 | 25.6 | 3.0 | 8.6× | |
| 12 | KS | 17.2 | 5.8 | 40.0 | 3.3 | 12.2× | |
| 13 | NC | 17.2 | 5.8 | 22.7 | 1.4 | 16.1× | |
| 14 | MI | 16.4 | 6.1 | 22.2 | 3.4 | 6.6× | |
| 15 | MO | 15.9 | 6.3 | 41.7 | 2.0 | 20.5× | |
| 16 | AZ | 15.3 | 6.6 | 17.5 | 5.5 | 3.2× | |
| 17 | AL | 15.0 | 6.6 | 28.6 | 4.8 | 6.0× | |
| 18 | FL | 13.9 | 7.2 | 16.1 | 3.2 | 5.0× | |
| 19 | MS | 13.9 | 7.2 | 50.0 | 4.3 | 11.7× | |
| 20 | NY | 13.8 | 7.2 | 16.4 | 4.8 | 3.4× | |
| 21 | LA | 13.8 | 7.2 | 41.7 | 3.8 | 10.9× | |
| 22 | MN | 13.8 | 7.3 | 24.4 | 4.6 | 5.3× | |
| 23 | CA | 13.4 | 7.5 | 13.2 | 2.6 | 5.0× | |
| 24 | PA | 12.5 | 8.0 | 10.0 | 7.6 | 1.3× | |
| 25 | IA | 11.7 | 8.6 | 32.3 | 6.0 | 5.4× | |
| 26 | MA | 11.1 | 9.0 | 21.3 | 7.2 | 2.9× | |
| 27 | NY | 9.6 | 10.4 | 15.9 | 8.3 | 1.9× | |
| 28 | TX | 8.7 | 11.4 | 10.9 | 27.0 | 0.4× | |
| 29 | NJ | 8.0 | 12.4 | 15.4 | 10.1 | 1.5× | |
| 30 | TN | 7.7 | 12.9 | — | 11.9 | — | |
| 31 | CA | 7.7 | 13.0 | 9.1 | Withheld* | — | |
| 32 | UT | 7.2 | 13.8 | 19.6 | 9.3 | 2.1× | |
| 33 | TX | 5.8 | 17.3 | 20.0 | 6.0 | 3.3× | |
| 34 | OK | 5.1 | 19.7 | 41.7 | 9.7 | 4.3× | |
| 35 | AL | 3.1 | 32.0 | 22.7 | 33.3 | 0.7× |
Source: AAVMC 2026 interactive report, Applicant Data, story points 4 and 5; linked by AAVMC Public Data. Overall figures use the tooltip counts in the CSV; residency values use publisher-rounded ratios. Workbook labeled Draft. Calculations: Castleport Test Prep. Checked September 29, 2026.
*Western's 0.7 non-resident applicants-per-seat value is retained, but its inverse and residency multiple are withheld because the pool definition is unresolved. Lincoln Memorial's resident figure was not verified; a dash is not zero.
Western's source reports 0.7 non-resident applicants per seat. Its inverse would exceed 100 seats per 100 applicants, so we retain the raw ratio but withhold that inverse and the residency multiple. Lincoln Memorial's resident value could not be verified. Both are excluded from paired summaries. A dash is not zero.
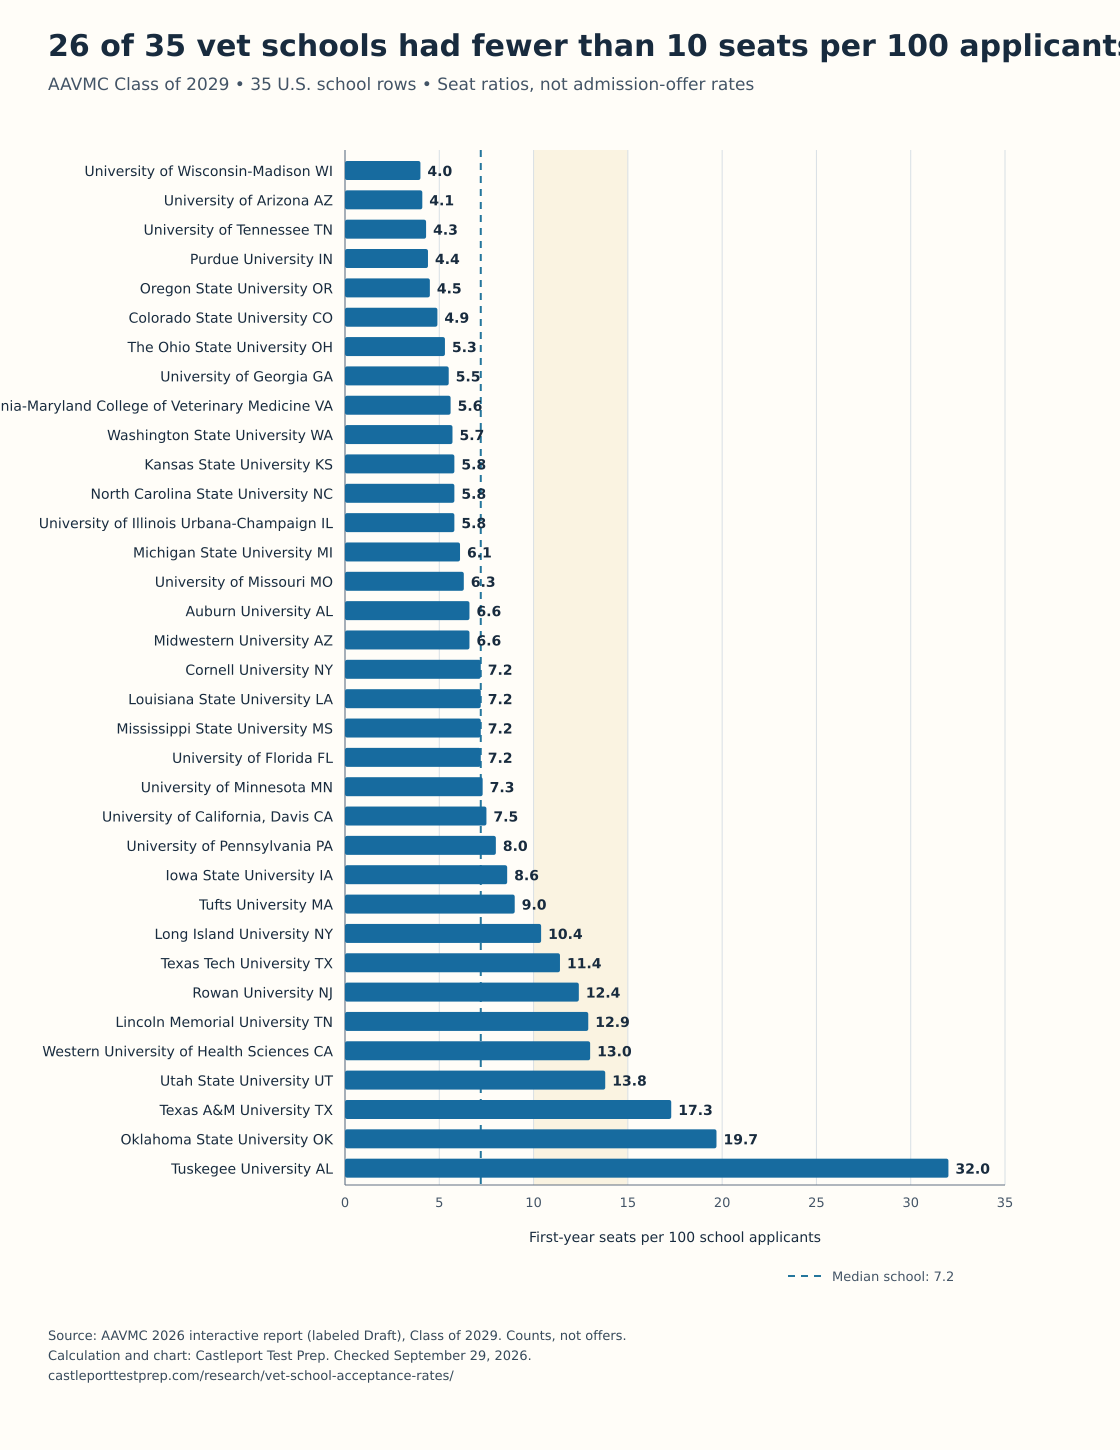
Here's how to read it. Wisconsin's reported pool had about 4 seats for each 100 applicants. Tuskegee's had 32. Those were different applicant pools; moving a person from one school to the other would not give them a measured eightfold boost.
What share of vet school applicants get a seat somewhere?
The sources checked do not establish one national share who got a seat. AAVMC reports 2.4 applicants per first-year seat in its 2026 report. That is a capacity ratio—not the percentage of people offered admission or who enrolled somewhere. Read the full AAVMC chart caption.
That's the distinction most applicants actually need: a seat count and a count of people who got in are not the same thing.
Why one school's rate and the national number are so different
Picture 100 people. Each one applies to 5 schools, so the schools get 500 applications. If 39 of those people land seats, the combined total is 7.8 seats per 100 applications. But count the people, and 39 of 100 got in somewhere.
Same students. Same seats. Two very different-looking numbers. This is a math example, not an observed national admission rate. It also describes the combined applications, not an identical rate at each school.
AAVMC's 2024–2025 report said applicants applied to 4 to 5 schools per cycle. Its 2026 report says 5 to 6 (older report; 2026 report). That is why adding up school applications double-counts people.
What would it take to calculate the national share?
The top and bottom counts must cover the same people, schools and cycle. For an admission-offer rate, the top count is unique people offered at least one place. For an enrollment share, it is those applicants who enrolled.
The older AAVMC report states 4,278 U.S. first-year students for the Class of 2028, but its 10,880-applicant captions disagree on the class label. The checked material also does not establish matching coverage for those two counts. Dividing them does not verify a national outcome rate.
AAVMC's national capacity method also differs from the U.S. school table: the older report's method includes adjusted capacity at international member schools. The 2026 caption gives 2.4, but not a matching national admission-offer count. We keep that published ratio under its own name rather than turn it into “2 in 5 get in.” (AAVMC methodology; 2026 caption)
What about the newest class?
13,174 people applied for the Class of 2030, according to AAVMC's 2025–2026 report. A matched national offer or enrollment total was not verified in this audit.
AAVMC also reports average annual growth of 2.7% in U.S. first-year enrollment from 2016 to 2026. That is a summary of past data, not a count of seats for the Class of 2030. We do not use it to forecast a current acceptance rate. (AAVMC 2025–2026 report)
| Measure | Value | Class or period | Source / limit |
|---|---|---|---|
| Reported applicant count | 10,880 | Older report: class captions conflict | AAVMC 2024–2025; not used for rates or growth |
| U.S. first-year students | 4,278 | Class of 2028 | AAVMC 2024–2025 |
| AAVMC national applicant-to-seat ratio | 2.4 applicants per seat | 2026 report, Class of 2029 chart caption | AAVMC 2026; capacity, not outcomes |
| Schools applied to per applicant | 4–5 | 2024–2025 report | AAVMC 2024–2025 |
| Applicants | 13,174 | Class of 2030 | AAVMC 2025–2026 |
| Schools applied to per applicant | 5–6 | 2026 report | AAVMC 2026 |
| Average yearly growth in U.S. first-year enrollment | 2.7% | 2016–2026 | AAVMC 2025–2026; publisher summary, not a forecast |
Sources: Links appear in the Source / limit cells of the table rows.
Checked September 29, 2026. None of these rows is a verified national admission-offer rate.
Where does the "10–15%" vet school acceptance rate come from?
Ross University's guide credits BeMo for the “10–15%” claim. We could not trace that statement to a dated primary measurement of admission offers. The Ross guide and BeMo page show that citation trail; they do not establish its original source.
BeMo's page, dated January 1, 2026, says average U.S. vet school acceptance rates sit around 10–15%. The passage does not identify a primary source, cohort or denominator for that range. Ross University's vet school guide repeats the range and credits BeMo. We looked for a primary source behind it — an association report, a government dataset, a school file — and didn't find one.
To be fair to the number: an offer rate is not a seat ratio. At UC Davis, offers and accepted offers were 7.8 versus 7.1 per 100 completed applications for the Class of 2029 (source). Our finding that 6 of 35 schools had 10 to 15 seats per 100 does not prove or disprove a national offer-rate claim. The missing primary source is the problem.
The "Colorado State 23%" claim
Colorado State's own page reports 3,410 applicants for a 174-seat first-year class: 5.1 seats per 100 applicants.
BeMo lists Colorado State as the vet school with the highest acceptance rate, at 23%. Colorado State's DVM Student Snapshot, checked September 29, 2026, shows about 20 applicants for every class place. AAVMC's Class of 2029 figures put Colorado State sixth among the 35 schools by applicants per seat, at 20.5 (AAVMC). Neither is a count of all admission offers, so neither alone disproves a historical 23% offer rate. We could not verify that claim's year or denominator.
Different numbers that all get called "acceptance rate"
An offer rate divides people offered a seat by people who applied, using the same group and cycle. Accepted offers, enrollment and seats answer different questions. The school sources below use those different labels.
| Measure | Top number | Bottom number | Where you'll see it |
|---|---|---|---|
| Offer rate | People offered admission | Matching applicants | UC Davis Class of 2029 |
| Accepted-offer/application ratio | People accepting offers | Matching applicants | Tennessee; UC Davis |
| Enrollment/application ratio | People who enrolled | Matching applicants | Missouri's accepted-and-enrolled count |
| Seats per 100 applicants | First-year seats | School applicants | AAVMC school ratios; Table 1 |
| National accepted-anywhere rate | Unique people offered at least one place | Unique applicants in the same national population and cycle | Not established by this audit |
| National capacity ratio | First-year places under the report's scope | Unique applicants under that scope | AAVMC national capacity measure, not an outcome rate |
Source: Castleport Test Prep classification of AAVMC, UC Davis, Tennessee and Missouri measures. Checked September 29, 2026.
Popular tables mix these up. One widely shared 2026 table says it divided enrolled students by applications — an enrollment measure — and then labeled the result "acceptance rate" (Inspira Advantage). The math can be fine. The label is what trips people.
How much does being in-state help at vet school?
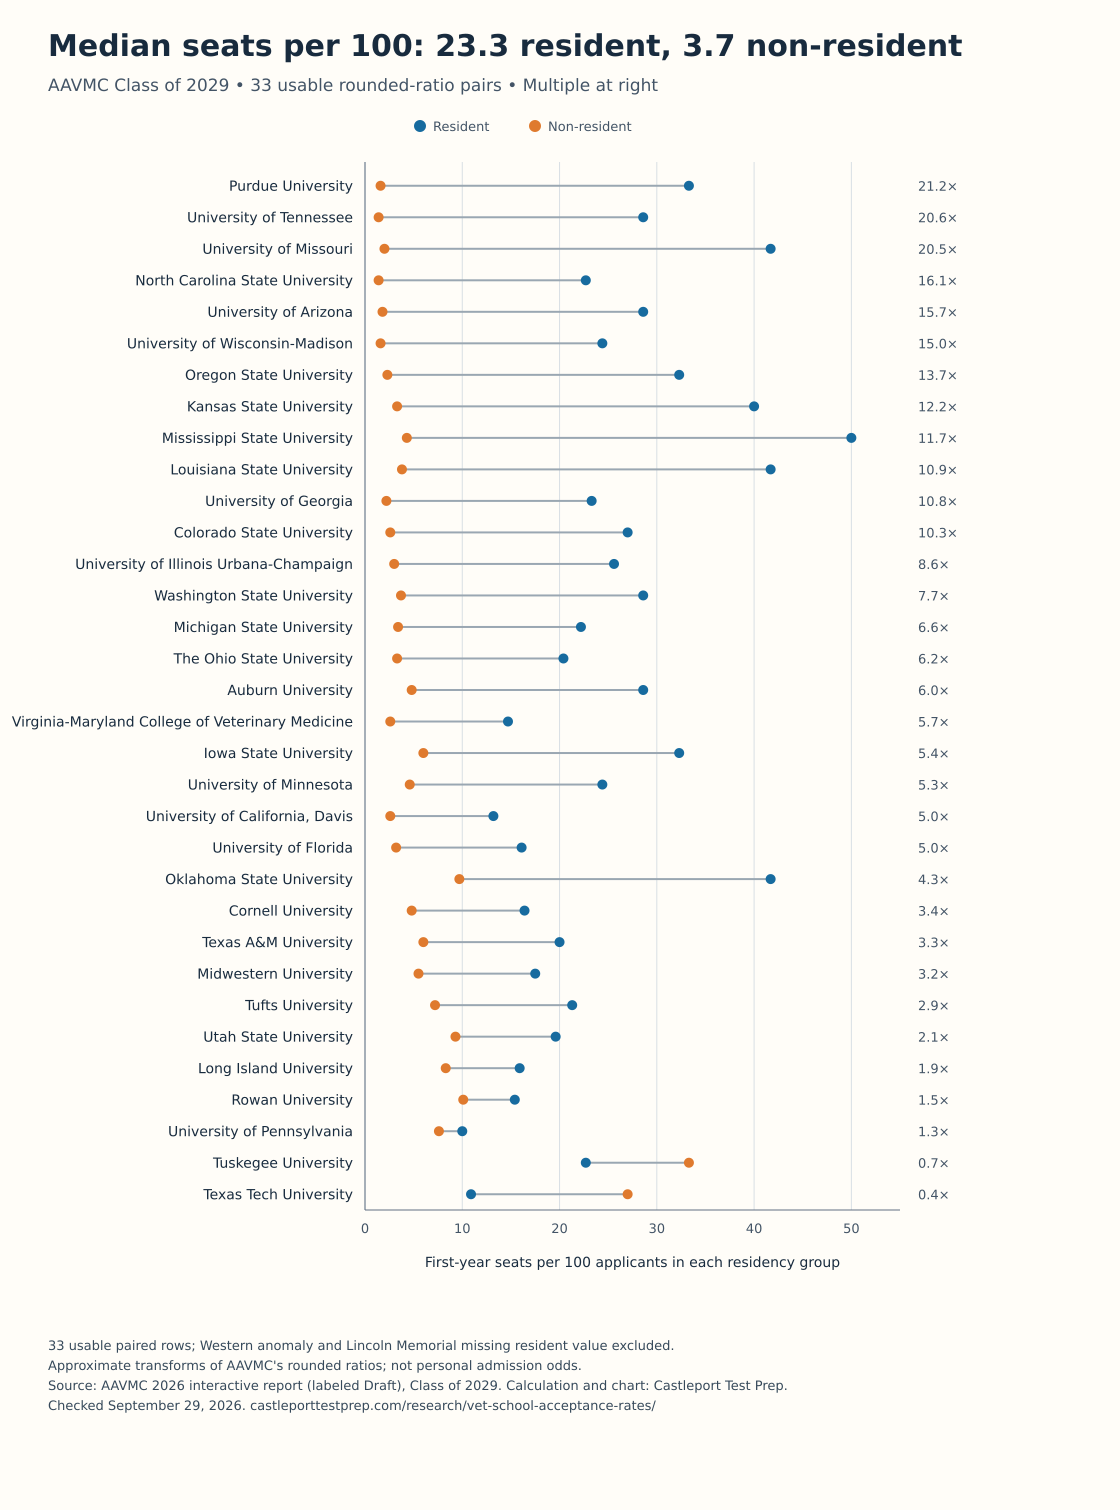
The group difference can be large. Across the same 33 usable school pairs for AAVMC's Class of 2029, the median was about 23.3 seats per 100 resident applicants and 3.7 per 100 non-residents. At 12 schools, the non-resident applicant-per-seat ratio was at least 10 times the resident ratio. AAVMC source; Castleport Test Prep calculations.
Think of Purdue. Its source reports 3.0 resident applicants per seat and 63.7 non-residents per seat. Same school, same class label. That is a 21.2-fold difference between groups—not proof that moving one applicant would multiply their chances by 21.
| School | Resident applicants per seat | Non-resident applicants per seat | Non-resident ratio ÷ resident ratio (approx.) |
|---|---|---|---|
| Purdue University | 3.0 | 63.7 | 21.2× |
| University of Tennessee | 3.5 | 72.2 | 20.6× |
| University of Missouri | 2.4 | 49.3 | 20.5× |
| North Carolina State University | 4.4 | 70.9 | 16.1× |
| University of Arizona | 3.5 | 54.8 | 15.7× |
| University of Wisconsin-Madison | 4.1 | 61.3 | 15.0× |
| Rowan University | 6.5 | 9.9 | 1.5× |
| University of Pennsylvania | 10.0 | 13.2 | 1.3× |
| Tuskegee University | 4.4 | 3.0 | 0.7× |
| Texas Tech University | 9.2 | 3.7 | 0.4× |
Source: AAVMC 2026 interactive report, Applicant Data story point 5. Largest six and smallest four of the same 33 usable pairs. Multiple = non-resident ratio ÷ resident ratio; approximate because the published ratios are rounded. Western and Lincoln Memorial are excluded for the reasons under Table 1. Checked September 29, 2026.
School-published numbers show different group gaps
Tennessee's 2024–2025 accepted-offer ratio was 28.6 per 100 resident applicants and 1.3 per 100 non-residents. UC Davis's Class of 2029 offer rates were 13.7% and 3.2%. These are different measures in different applicant groups, not estimates of how much moving would improve one person's chances. (Tennessee; UC Davis)
| School | Class or period | What's counted | Resident per 100 | Non-resident per 100 | Ratio of displayed measures |
|---|---|---|---|---|---|
| University of Tennessee | 2024–2025 | Accepting offers ÷ applicants | 28.6 (71 of 248) | 1.3 (28 of 2,091) | 21.4× |
| Oklahoma State University | Class of 2030 | Stated seats ÷ applications; includes early-admission routes | 34.7 (69 of 199) | 2.9 (37 of 1,264) | 11.8× |
| University of Florida | Class of 2030 | Table 1 final class ÷ pool; class-total conflict | 14.4 (99 of 686) | 2.1 (50 of 2,338) | 6.7×, Table 1 only |
| UC Davis | Class of 2030 | Accepted counts shown; offers/accepted conflict | 129 of 972; rate withheld | 25 of 1,176; rate withheld | Withheld |
| UC Davis | Class of 2029 | Offers ÷ completed applications | 13.7 (132 of 962) | 3.2 (36 of 1,139) | 4.3× |
| University of Minnesota | Class of 2030 | Approximate seats ÷ applications; residents include MN and ND | about 19.5 (53 of 272) | about 3.8 (52 of 1,366) | about 5.1× |
Sources: Tennessee, Oklahoma State, Florida, UC Davis 2030 and 2029, and Minnesota. Calculations use full counts, not the rounded ratios shown. Florida's printed final-class table totals 149; its next table states 150. We retain the group-table arithmetic without treating it as a settled final total. Oklahoma's comparison is capacity, not an applicant outcome. Checked September 29, 2026.
"In-state" can cross state lines
Residency rules are set by each school. Minnesota's Class of 2030 resident pool includes Minnesota and North Dakota (Minnesota profile). LSU's Class of 2029 included 102 students from Louisiana, 20 from Arkansas and 21 from Puerto Rico (LSU). Those home-location counts alone do not establish a residency preference. If your state has no vet school, check each school's residency page before you assume you're "out-of-state" everywhere.
One school, four acceptance rates: the UC Davis example
UC Davis's Class of 2029 profile supports four honest numbers: 7.8% of completed applicants got offers, 7.1% accepted offers, 13.7% of California applicants got offers, and 3.2% of out-of-state applicants did. The offer rate answers the acceptance question; the other measures need their own labels.
| Group | Completed applications | Interviews | Offered admission | Accepted | Offers per 100 | Accepted per 100 |
|---|---|---|---|---|---|---|
| California | 962 | 200 | 132 | 127 | 13.7 | 13.2 |
| Out of state | 1,139 | 40 | 36 | 27 | 3.2 | 2.4 |
| International | 57 | 0 | 0 | 0 | 0.0 | 0.0 |
| All | 2,158 | 240 | 168 | 154 | 7.8 | 7.1 |
Source: UC Davis Admission Profile, Class of 2029. Rates: Castleport Test Prep calculation. Checked September 29, 2026.
There's even a fifth number hiding here. UC Davis says it received more than 3,000 VMCAS applications, and only 2,158 finished its own requirements. The source does not give an exact count above 3,000. Using 154 accepted offers over that larger pool would give less than 5.14 per 100, not the 7.1 per 100 completed applications. That is a denominator illustration, not a second exact rate.
The newest UC Davis class
For the Class of 2030, UC Davis reports 2,184 completed applications, 153 offers and 154 accepted students. The California rows show 128 offers but 129 acceptances. Those figures do not reconcile. (UC Davis profile)
We don't present a settled rate for this profile. Its application-attempt counts also sum to 152, not 154. The overview gives a class of 155, including one deferred student, but that does not explain why accepted offers exceed offers. All reported counts stay in the download; we do not guess which one to change.
Same class, two starting counts: Rowan
Rowan University's first vet class had 75 students. That's 12.4 per 100 completed applications, or 5.6 per 100 started applications.
Rowan reports 1,336 started applications and 603 completed ones, so fewer than half of the people who started finished (Rowan class of 2029 profile). Pick one count or the other and the "rate" more than doubles. Same 75 students.
The difference is 2.22-fold, calculated from 1,336 ÷ 603. Neither class-size ratio tells us how many total admission offers Rowan made.
| Class of 2029 count | Application pool | Applications | Class places per 100 |
|---|---|---|---|
| 75 | Completed | 603 | 12.4 |
| 75 | Started | 1,336 | 5.6 |
Source: Rowan Class of 2029 profile. Calculations: Castleport Test Prep; 75 ÷ 603 × 100 and 75 ÷ 1,336 × 100. Checked September 29, 2026.
What are the newest acceptance numbers schools posted?
The recent school sources do not all publish the same outcome. Missouri reports 126 accepted-and-enrolled students and 2,102 applications for the Class of 2029 (6.0 per 100). Minnesota reports about 105 seats and 1,638 applications for the Class of 2030 (about 6.4 per 100). (Missouri; Minnesota)
The table keeps offers, accepted offers, enrollment and seats separate. It includes 15 schools checked, with unresolved counts clearly marked. It is not a ranking of acceptance rates.
| School | Class or period | What's counted | Numbers | Per 100 | Primary source |
|---|---|---|---|---|---|
| University of Tennessee | 2024–2025 | Students accepting offers ÷ applicants | 99 of 2,339 | 4.2 | School |
| North Carolina State University | 2026 reporting year | Applications; generic class policy kept separate | 2,885 applications; policy of 125 places | Not an observed rate | School |
| Purdue University | Class of 2030 | First-day enrollment; application scope not matched | 88 enrollees; 1,930 applications | Withheld | School |
| University of Florida | Class of 2030 | Final class / application pool; conflicting class totals | 149 in Table 1; 150 in Table 2; pool 3,024 | 4.9 or 5.0, table-specific | School PDF |
| Colorado State University | Current first-year class; year not stated | Class size ÷ applicants | 174 of 3,410 | 5.1 | School |
| University of Missouri | Class of 2029 | Accepted and enrolled ÷ applications | 126 of 2,102 | 6.0 | School PDF |
| UC Davis | Class of 2030 | Offers and accepted counts conflict | 153 offers; 154 accepted; 2,184 completed applications | Withheld | School PDF |
| Louisiana State University | Class of 2029 | Incoming class ÷ applicants | 200 of 2,776 | 7.2 | School |
| Oklahoma State University | Class of 2030 | Stated seats ÷ applications | 106 of 1,463 | 7.2 (capacity) | School |
| Rowan University | Class of 2029 (first class) | Class size ÷ completed applications | 75 of 603 | 12.4 | School PDF |
| Cornell University | Class of 2029 | Incoming DVM class | 128; matching applications not given in this report section | — | Annual report |
| Texas A&M University | Class of 2029 | Matriculated students | 180 (38 men + 142 women); no applications on this page | — | School |
| Tufts University | Class of 2030 linked profile | Image-only figures not verified in this audit | Current hub and V30 page retrieved; counts unavailable to the audit | — | School hub |
| University of Minnesota | Class of 2030 | Approximate seats ÷ applications | 105 of 1,638 | about 6.4 | School |
| University of Wisconsin–Madison | Title says 2030; description says 2027 | “Invited” label and cohort unresolved | 100 invited; 2,530 applicants | Withheld | School |
Sources: Primary source links are listed in the table rows.
Per 100: Castleport Test Prep calculation from the indicated counts. Purdue's enrollment includes VMCAS, VetUp!, Vet Scholars and readmission; the page does not establish a matching regular-applicant outcome. NC State's generic class policy is not a measured enrollment total for its 2026 application row. Florida's two totals are both shown, not combined. Checked September 29, 2026.
Why these don't line up with Table 1
Table 1 uses one AAVMC class label (2029) and one seat measure for 35 schools. Table 7 uses school-published figures with different periods and counting rules. Read the label on each, even when the class names match. A published class can include early-entry routes; a descriptive class/application ratio is not automatically the success rate of regular applicants.
Some sources differ within the same class. AAVMC lists 201 seats for LSU, while LSU's welcome article describes 200 incoming students. For Missouri, AAVMC lists 132 seats, while the school guide says 126 accepted and enrolled; both use 2,102 applications. For UC Davis, AAVMC uses 157 seats and 2,101 applicants, while the school profile shows 2,158 completed applications and 154 accepted offers. We keep those sources separate rather than guess why they differ. (AAVMC; LSU; Missouri; UC Davis)
Oklahoma State shows why the period matters, too. AAVMC's Class of 2029 row has 106 seats and 539 applicants (19.7 seats per 100). The school's Class of 2030 page lists 106 seats and 1,463 applications (7.2 per 100). Those are different source periods and may use different application rules; the comparison does not by itself prove a change in personal admission odds. (Oklahoma State)
Is it getting harder to get into vet school?
Application demand rose at the two schools with time series below: Tennessee had 119% more applicants in 2024–25 than in 2018–19, and NC State had 34% more applications in 2026 than in 2025. These school trends do not establish one national change in admission chances. (Tennessee; NC State)
When applications grow faster than seats or accepted offers, the ratio falls. These two school series show what changed without assuming why.
Tennessee: applicants more than doubled; accepted offers rose 16%
At the University of Tennessee, applicants rose from 1,067 in 2018–19 to 2,339 in 2024–25, while students accepting offers rose from 85 to 99. That dropped the rate from about 8.0 to 4.2 per 100 applicants.
| Year (school label) | Total applicants | Tennessee applicants | Out-of-state applicants | Invited to interview | Accepting offers | Accepting offers per 100 applicants |
|---|---|---|---|---|---|---|
| 2018–2019 | 1,067 | 157 | 910 | 401 | 85 | 8.0 |
| 2019–2020 | 1,086 | 235 | 851 | 427 | 88 by residency; 87 by sex | Withheld: totals conflict |
| 2020–2021 | 1,320 | 238 | 1,082 | 466 | 87 | 6.6 |
| 2021–2022 | 1,607 | 224 | 1,383 | 465 printed; 484 from group rows | 90 | 5.6 |
| 2022–2023 | 1,887 | 232 | 1,655 | 415 | 95 | 5.0 |
| 2023–2024 | 2,178 | 239 | 1,939 | 348 | 103 | 4.7 |
| 2024–2025 | 2,339 | 248 | 2,091 | 390 | 99 | 4.2 |
Source: University of Tennessee College of Veterinary Medicine, Academic Statistics. Per 100: Castleport Test Prep calculation. Checked September 29, 2026.
Here's the everyday version. In 2018–19, about 8 of every 100 applicants to Tennessee accepted offers. Six years later, about 4 did. Out-of-state applications did most of the growing: 910 to 2,091.
NC State: a one-year jump, almost all from out of state
NC State's DVM applications rose 34% in one year, from 2,150 in 2025 to 2,885 in 2026. Out-of-state applicants accounted for 710 of the 735 added applications.
| Admission year (school label) | Applied | In-state | Out-of-state |
|---|---|---|---|
| 2022 | 1,976 | 355 | 1,621 |
| 2023 | 2,028 | 377 | 1,651 |
| 2024 | 1,860 | 358 | 1,502 |
| 2025 | 2,150 | 448 | 1,702 |
| 2026 | 2,885 | 473 | 2,412 |
Source: NC State College of Veterinary Medicine, admissions FAQ. NC State says it admits a class of 125 each year, about 100 in-state and 25 out-of-state. Checked September 29, 2026.
As a capacity illustration, NC State's stated policy of about 25 non-resident places divided by its 2,412 non-resident applications in 2026 gives about 1 place per 100 applications. About 100 resident places divided by 473 resident applications gives about 21 per 100. These calculations use a general class policy, not measured enrollment or offers for that year.
Is vet school harder to get into than med school?
U.S. MD medical schools had 24,300 acceptees from 54,699 applicants in 2025–26: 44.4 per 100. They enrolled 23,440 first-year students, or 42.9 per 100 applicants. (AAMC data tables; Castleport Test Prep calculations.)
Those are national medical-school outcomes. We did not verify a matched national vet-school offer or enrollment rate. Comparing the medical figures with a single vet school's seat ratio—or with an unmatched national capacity calculation—would not tell us which is harder.
“Accepted” and “enrolled” differ even in the medical data. The source gives both, so we keep both rather than use them as synonyms. MD means Doctor of Medicine; the AAMC series covers U.S. MD-granting schools, not every route to becoming a physician.
How many times do people apply before getting into vet school?
In these two published groups, most students got in on their first application, but a real share didn't. At Colorado State, 137 of 174 first-year students were admitted on their first try and 37 (21%) needed two or more. At UC Davis, 130 of 154 in the Class of 2029 got in on their first application.
So if you don't get in the first time, you'd have plenty of company in the class that does. At Colorado State, about 1 in 5 students took at least two tries (Colorado State; UC Davis).
Why this matters now
The VMCAS 2027 application cycle closed on September 15, 2026, according to the AAVMC VMSAR banner. That application-cycle label is not the same as the Class of 2029 label in Table 1.
The posted AVMA accreditation list, checked September 29, contains 37 U.S. programs including Puerto Rico: 30 accredited, 2 with probationary accreditation and 5 with provisional accreditation. The list links to its June 2026 update; this is a count of that posted list, not a claim that no newer accreditation action exists.
Rowan and Utah State are in AAVMC's 35-school comparison. LMU's Orange Park program and Universidad Ana G. Mendez in Puerto Rico are on the posted accreditation list but not in these AAVMC rows. The list separately shows Arkansas State and Clemson with letters of reasonable assurance; they are not included in the 37 accredited-program count. The AAVMC report and the free program-roster CSV preserve that scope.
That's why a single old percentage can mislead you. Check the class year on any number before you lean on it.
If you're building your school list, the next number worth checking is how each school's graduates do on the licensing exam: NAVLE pass rates by veterinary school.
How we built this
We read the visible counts and ratios for 35 schools in AAVMC's 2026 interactive report, calculated seats per 100 applicants, and checked school-published sources for 15 schools. Checks were made on September 29, 2026. Unreadable or conflicting figures are marked, not filled in.
- What we collected. The interactive report linked by AAVMC for its Class of 2029 overall and residency measures; the 2024–2025 and 2025–2026 PDFs for national context; school pages and PDFs; AAMC's 2025–26 data tables; and the posted AVMA list. The live AAVMC workbook is labeled Draft. We read its visible tooltips; we did not estimate bar lengths or bypass its disabled data-download controls.
- How we processed it. Overall seats per 100 = first-year seats ÷ school applicants × 100. Applicants per seat uses the same raw counts in reverse. Residency seats per 100 = 100 ÷ the publisher-rounded residency ratio, so those values are approximate. The non-resident/resident multiple uses the two published ratios before rounding the result. Table ratios use one decimal, rounded half up; some text rounds percentages to whole numbers. Rowan's denominator comparison uses two decimals (2.22-fold). Sorting, overall medians and band counts use unrounded calculations.
- Which rows enter summaries. The overall median and bands use all 35 schools. Both residency medians and the tenfold count use the same 33 paired schools, excluding Western's unresolved 0.7 non-resident ratio and Lincoln Memorial's unverified resident value. The median is the middle school value, not the ratio of all seats to all applications. We do not sum school applicants and call them unique people.
- Rules we kept. We didn't work backward from a rounded rate to guess a count. We kept each school's own labels ("accepted," "final class," "seats"). When a source contradicted itself, we showed both numbers or skipped the rate. Missing values stay missing, never zero. A class policy is not measured enrollment, and a mixed-route enrollment count is not silently paired with regular applications.
- Why the school table uses the Class of 2029. The newer report's live tooltips let us verify all 35 overall rows, including exact seats and applicant counts. The live tooltips provide exact counts that the PDF bar charts do not label. We use those tooltips rather than estimate bar lengths. We retain AAVMC's class label without assuming every program has the same course length or entry date.
- How to reproduce it. Open the AAVMC Public Data page, then its interactive report. Select Applicant Data, story point 4 for overall counts and 5 for residency. Hover each bar and scroll to the bottom to include all 35 schools. Match each tooltip to the school CSV. Use the formulas above, then check the raw school rows and formulas in the counts and calculations CSVs. The program-roster CSV reproduces the 37-program count from the posted accreditation list.
What this data does and doesn't show
It shows school applicants per first-year seat under one AAVMC measure. It doesn't show any one person's chances, a school's offer rate, or which school is better.
- Seats, not offers. Table 1 counts seats. Offers, accepted offers and enrollment are separate outcomes.
- One source label, not today's odds. Table 1 uses AAVMC's Class of 2029 label. Newer school figures stay separate and retain their own periods. The 2026 title names this audit edition, not a common enrollment year for all rows.
- Raw overall counts; rounded residency ratios. The download preserves exact tooltip seats and applicants. Residency transformations are approximate; no subgroup count is inferred from a rounded ratio.
- No verified national accepted-anywhere rate. The 2.4 capacity ratio and the 13,174 applicant count are different reported measures. Unmatched national counts are not turned into a success rate, an uncertainty range or a forecast.
- Source conflicts stay visible. Western's residency ratio, UC Davis's Class of 2030 offers and attempt totals, Florida's 149/150 class totals, Tennessee's two conflicting cells, Purdue's mixed entry routes and Wisconsin's class labels are not silently resolved.
- School-published numbers don't match each other. Classes, labels and counting rules differ, which is why Table 7 names what each one counts. Same-class AAVMC and school differences are shown too.
- Coverage and access. The 35-school table is not a complete current accreditation list. Tufts's linked Class of 2030 image figures could not be verified; its Class of 2029 AAVMC row remains available. Wisconsin's current raw table is retained with its unresolved labels, not converted into a clean rate.
- Not advice. Admissions decisions belong to each school. Residency rules belong to each school and state.
How to cite this page
Castleport Test Prep Editorial Team. "Vet School Acceptance Rates: 35 U.S. Schools on One Measure." Castleport Test Prep. Last updated September 29, 2026. https://castleporttestprep.com/research/vet-school-acceptance-rates/
Each table and chart carries its own source line. Section links work too, for example https://castleporttestprep.com/research/vet-school-acceptance-rates/#how-much-does-being-in-state-help-at-vet-school.
Reuse: You may reuse Castleport Test Prep's original analysis, original table arrangement and chart designs with credit to Castleport Test Prep. This permission does not cover third-party text, images or other protected material; preserve the named sources' attribution and follow their terms. A link is not required.
Download the data
Five free CSV files, version 2026-09-29, no sign-up. Every row carries its source link and check date.
- vet-school-acceptance-rates-by-school.csv — 35 rows. Exact AAVMC Class of 2029 overall counts, publisher ratios, calculated seats per 100, and explicit residency-pair status.
- vet-school-published-admissions-counts.csv — 147 rows from 15 schools. Reported counts, periods, source labels, calculation status and unresolved conflicts.
- vet-school-national-admissions-figures.csv — 30 rows. National context, medical-school outcomes and labeled summaries of the school comparison. No projected admission rate.
- vet-school-audit-calculations.csv — 20 calculations. Exact inputs, formulas, results, units and limitations for the supporting findings.
- vet-school-program-roster.csv — 37 programs from the posted AVMA list, including Puerto Rico, with status and whether the program appears in Table 1.
Blank numeric fields mean unavailable or withheld, never zero. per_100 uses the row's stated numerator and denominator; a GPA row has no percentage. table_ratio_conflict means the arithmetic is reproducible but the source's class totals disagree. capacity_ratio compares places and applications, not offers. approximate preserves an estimate label from the school. not_verified records an audit access limit.
Frequently asked questions about vet school acceptance rates
What are the odds of getting into vet school?
At the median of the 35 schools in AAVMC's Class of 2029 comparison, there were 7.2 seats per 100 applicants. That is a school-level seat ratio, not a national share accepted anywhere or a personal probability. A matched national offer or enrollment rate was not verified. (AAVMC; Castleport Test Prep calculations.)
Is it harder to get into vet school or med school?
U.S. MD schools had 44.4 acceptees and 42.9 enrollees per 100 applicants in 2025–26, using AAMC's published counts. This audit does not establish a matched national vet-school outcome rate. Comparing either medical figure with one vet school's seat ratio would not answer which is harder.
What GPA do you need to get into vet school?
There's no single national cutoff; each school sets its own rules. As one example, UC Davis's admitted Class of 2030 averaged a 3.68 science GPA for California residents and 3.83 for out-of-state students. A class average isn't a minimum, so check each school's current requirements. (UC Davis profile; Cornell admissions policies)
What is the #1 vet school in the U.S.?
This page doesn't rank school quality. By applicants per seat in AAVMC's Class of 2029 comparison, Wisconsin had the highest ratio (25.3), followed by Arizona (24.5) and Tennessee (23.2). This orders application volume per seat, not school quality. (AAVMC) For how graduates do on the licensing exam, see NAVLE pass rates by veterinary school.
Which vet school is easiest to get into?
Tuskegee (3.1 applicants per seat), Oklahoma State (5.1) and Texas A&M (5.8) had the fewest applicants per seat in AAVMC's Class of 2029 comparison. That does not establish the easiest school for a person to enter. Texas A&M's non-resident ratio was 16.7, and Oklahoma State's Class of 2030 page shows 13.8 applications per seat—different groups and periods give different answers.
Does being in-state really help for vet school?
Across the same 33 usable school pairs, the median was about 23.3 seats per 100 resident applicants and 3.7 per 100 non-residents for AAVMC's Class of 2029. At Purdue, the reported applicant-per-seat ratios were 3.0 and 63.7. These group differences do not measure the effect of moving one applicant. (AAVMC; Castleport Test Prep calculations.)
How many people apply to vet school each year?
13,174 people applied for the Class of 2030, according to AAVMC's 2025–2026 report. That count alone does not tell us how many received an offer. Applicants apply to 5 to 6 schools on average, so schools see far more applications than there are people. (AAVMC report; interactive caption)
How many vet schools are in the U.S.?
The posted AVMA list contains 37 U.S. programs, including Puerto Rico, when accredited, probationary and provisional categories are counted together: 30, 2 and 5 respectively. The posted list links to its June 2026 update; this count was checked September 29, 2026. The 35-school AAVMC table includes Rowan and Utah State but not LMU Orange Park or Universidad Ana G. Mendez; the roster CSV shows each entry.
What does "acceptance rate" mean for vet school?
Strictly, it's offers of admission divided by applications. The sources on this page also report accepted offers, enrolled students or seats. Those are different measures. At UC Davis for the Class of 2029, 7.8% of completed applicants got offers and 7.1% accepted offers. (UC Davis; Castleport Test Prep calculations.)
How many times do people apply before getting into vet school?
Most students in these two published groups got in on their first application. At Colorado State, 137 of 174 first-year students were admitted on the first try and 37 (21%) needed two or more. At UC Davis, 130 of 154 in the Class of 2029 got in on the first application. (Colorado State; UC Davis)
Does this page cover vet tech programs?
No. This page covers Doctor of Veterinary Medicine (DVM) admissions. Veterinary technician programs are a separate route with their own exam; see VTNE pass rates by school.
Sources and check dates
- American Association of Veterinary Medical Colleges. 2024–2025 Annual Data Report. National-method context and the stated Class of 2028 enrollment count; applicant caption conflict retained. Checked September 29, 2026.
- AAVMC. 2025–2026 Annual Data Report. Class of 2030 applicant count and publisher-reported enrollment growth; relevant PDF pages inspected. Checked September 29, 2026.
- UC Davis. Admission Profile for the Class of 2029. PDF counts checked visually. Checked September 29, 2026.
- UC Davis. Admission Profile for the Class of 2030. PDF counts checked visually; offer and attempt-total conflicts retained. Checked September 29, 2026.
- Colorado State University. DVM Student Snapshot. Current first-year snapshot; no cohort year asserted from the checked page. Checked September 29, 2026.
- NC State. Admissions FAQ. Application-year series and separate class policy. Checked September 29, 2026.
- Oklahoma State. Incoming Class Statistics. Class of 2030 and 2026 application cycle; early-admission note retained. Checked September 29, 2026.
- University of Missouri. Admissions Resource, 2025–2026 guide: Class of 2029. PDF checked visually. Checked September 29, 2026.
- University of Tennessee. Academic Statistics. Both 2019–2020 accepted-offer totals and the 2021–2022 interview-invitation conflict retained. Checked September 29, 2026.
- University of Florida. Admissions Information, Class of 2030; source dated August 15, 2026. PDF tables checked visually; 149/150 totals retained. Checked September 29, 2026.
- LSU. LSU Vet Med Welcomes the Class of 2029, August 11, 2025. Incoming class, not total offers. Checked September 29, 2026.
- Purdue. Admitted Applicant Statistics; updated August 27, 2026. Mixed entry routes retained. Checked September 29, 2026.
- Rowan. Class of 2029 Statistics. PDF checked visually; started and completed denominators kept separate. Checked September 29, 2026.
- Cornell. Admissions Decisions. Policies, not a class-size denominator. Checked September 29, 2026.
- Texas A&M. Admissions Statistics; modified May 1, 2026. Class of 2029 matriculated students, no applicant denominator on the page. Checked September 29, 2026.
- Tufts. D.V.M. Class Profiles. Hub and linked V30 profile retrieved; image-only counts not verified. Checked September 29, 2026.
- AAVMC Research. 2026 AAVMC Annual Data Report - Draft, public interactive workbook, last published September 9, 2026. Applicant Data story points 4 and 5: visible tooltips for all 35 schools; no bar-length estimates. Checked September 29, 2026.
- Association of American Medical Colleges. 2025 Fall Applicant, Matriculant, and Enrollment Data Tables. Applicant/Matriculant Data File as of October 28, 2025; document dated November 18, 2025. Applicant, acceptee and matriculant tables. Checked September 29, 2026.
- American Veterinary Medical Association. Accredited veterinary colleges. Posted online roster linked to June 2026 update; 37 U.S. entries including Puerto Rico; reasonable-assurance entries excluded. Checked September 29, 2026.
- AAVMC. Veterinary Medical School Admission Requirements, 2026 Edition for Application Cycle 2027. September 15, 2026 closing banner verified. Checked September 29, 2026.
- BeMo. Veterinary School Acceptance Rates, dated January 1, 2026. Used only to document the repeated claim, not as admissions data. Checked September 29, 2026.
- Ross University. How Hard Is It to Get Into Vet School? Full page read; the 10–15% passage credits BeMo. Checked September 29, 2026.
- Inspira Advantage. Veterinary School Acceptance Rates in the USA in 2026. Full methodology read; it divides matriculants by applications. Checked September 29, 2026.
- University of Minnesota. Class profile, Class of 2030. Figures labeled approximate; resident pool includes Minnesota and North Dakota. Checked September 29, 2026.
- Cornell. Annual Report 2025. Class of 2029 incoming DVM group of 128. Checked September 29, 2026.
- University of Wisconsin–Madison. Applicant Statistics. Table retrieved; title says 2030 and description metadata says 2027; Invited is not relabeled. Checked September 29, 2026.
- AAVMC. Public Data. Official landing page linking the interactive workbook. Checked September 29, 2026.
- Tufts. Linked V30 Class Profile on Adobe Express. Page retrieved; numerical image verification unsuccessful, no counts inferred. Checked September 29, 2026.
Who made this page
Castleport Research is the public reference section of Castleport Test Prep, an independent exam-prep publisher. This page was built by the Castleport Test Prep Editorial Team; it isn't an AAVMC, AAMC, AVMA or school publication. Found an error? Send the page, the number and the source through our corrections process. Our methodology explains how we check every figure.